

Ever since I started the whole “Reader Mailbag” theme on TRB, I’ve been getting way more emails!
I find the topics interesting.
Everything from marijuana, to agents harassing previous clients, to the appropriate size of washer/dryers!
After Monday’s blog in which we examined the average home price in Toronto this past September, and weighed it against previous periods, a colleague from another brokerage emailed me the following:
Hi David,
I’m curious to hear your thoughts on a new theory.
Maybe the prices don’t actually fall every year in the quieter months.
Maybe those times are just more quiet for houses then they are for condos.
So the ratio of condos sold to houses sold is greater than in the spring season.
This would push the average price lower even though no houses/condos are actually selling for less.
Any thoughts?
Thanks
I know I’ve explored this topic before. If I wasn’t sitting in the office at 11pm, basically bleeding from both eyes as I look at the screen, I would dive into the blog archives and find it.
But for now, let’s examine this anew.
We know two things for certain:
1) Average home price fluctuates during the year
2) There are busier/quieter times for certain property types and price points
If we were to expand on the first point, I would further say:
a) April, May, and June, plus September and October, are busier months, with more sales, and the highest average home prices
b) We fully expect to see depressed prices in January, December, and quite often, August
Now if we were to expand on the second point, I would add:
a) The condo market is far less cyclical than the housing market
b) The housing market usually works around the school calendar, and peak seasons for the overall market are peak seasons for freehold homes
So what if we combine these points? What’s the conclusion?
Well, my colleague who wrote the email above has a theory that it’s not so much the prices that are going up and down, but rather the proportions of property types.
See, I know we talked about this once last year. I remember offering the exact same theory!
To better understand this theory, for those of you that don’t like numbers, let’s use a crude example.
Pretend that there is a town, which we’ll call Anytown, where all houses cost $1,000,000, and all condos cost $600,000. Maybe they cost that much, and maybe they average that much, but for the purposes of this example, it’s the same thing.
Now let’s assume that the market is very cyclical in Anytown, and we see far more condos sold in the winter, and far more houses sold in the summer. The proportion of houses to condos builds as we move through the year, starting in January.
Let’s further assume that there were 100 properties sold in each month, and we’ll pull data from Anytown sales in January, March, and June for demonstration purposes:
January:
70 condos
30 houses
=$720,000 average sale price
March
50 condos
50 houses
=$800,000 average sale price
June
30 condos
70 houses
=$880,000 average sale price
Sidenote: would they teach this in school? Like, in Grade 12, I’m assuming? My mother supply-taught Grade 8 the other day and she said the kids sit on their phones the entire time, under the guise of “group discussions.” I have no idea why cell phones are allowed in class, but I digress…
So notice how the proportion of sales changes the average sale price.
And in this example, the actual prices don’t change, but rather the average does.
Now can this be applied to our market?
Let’s find out!
I pulled all the data from 2018, just to get us started…
Not that this will mean anything to you by looking at it, but here is the breakdown of all property types in each month last year (excluding co-op, co-own, and detached condo, since there are maybe a dozen in any given month):
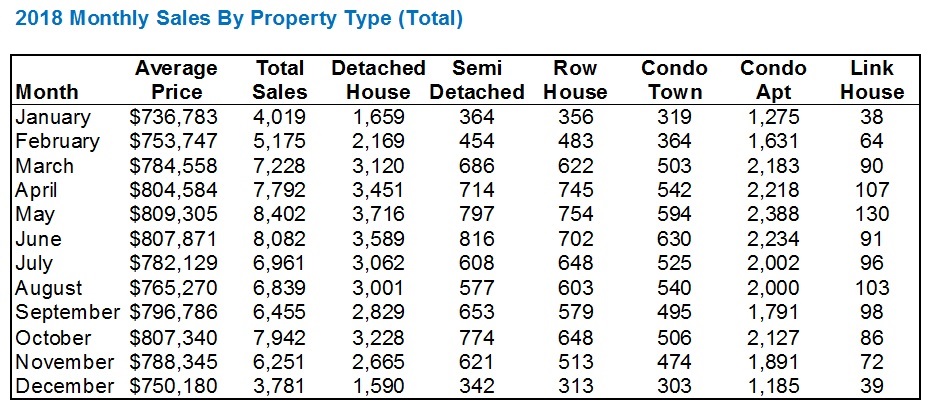
As I said, the data set itself doesn’t do much for you, although perhaps the average price and total sales figures are eye-catching.
You’ll note that, as we commonly discuss on TRB, peak months for both average price and total sale are April/May/June and then September/October.
You’ll also note, as per Monday’s blog, that October always trumps September, and May always trumps April. June, for what it’s worth, almost always lags behind May ever so slightly, but does finish higher now and again.
These numbers don’t do much for us on their own, but the percentage of each property type, in relation to total sales, will be half of the discussion today, so let’s look at that:
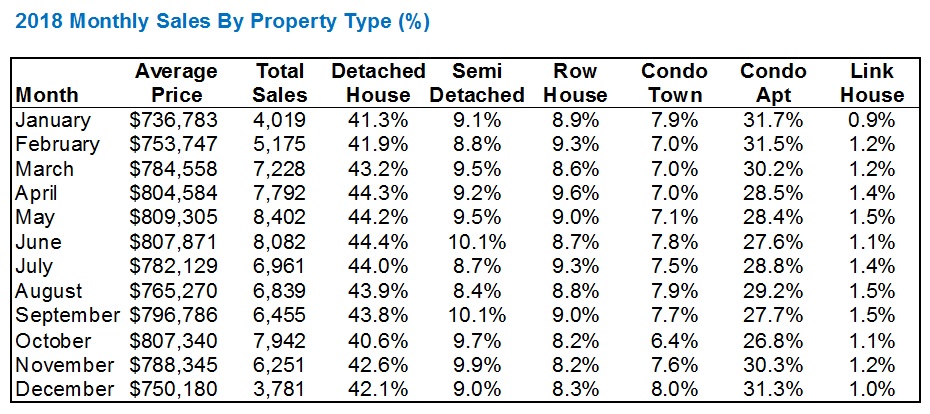
Here we can see that in “peak” months for sales and price, the percentage of detached homes are also peaked.
We go from 41.3% and 41.9% in January and February up to 43.2% in March, then 44.3%, 44.2%, and 44.4% in the peak months of April, May, and June.
At the same time, the complete opposite is true for condos.
The year starts busy with 31.7% and 31.5%, but then drops to 30.2% in March, and then 28.5%, 28.4%, and 27.6% in the peak months of April, May, and June.
These numbers aren’t nearly as pronounced as those in my Anytown example, but are they enough to change the results.
Look at January, for example, where 41.3% of sales are for detached houses, and 31.7% are for condos. The average sale price is $736,783. In June, when the average home price is $807,871, 44.4% of sales are for detached houses, and 27.6% of sales are for condos.
But what if the proportions were the exact same in January as they were for June?
With detached home sales between $1.2-$1.3M in early 2018, and condo sales between $590-$640K, it seems to reason that having 3% more detached home sales and 4% fewer condo sales would dramatically increase that $736,783 figure.
Perhaps this goes without saying for some of you, but for others, it’s simply a matter of “houses are worth more during peak periods.”
Maybe they’re not.
Maybe the data just tells us that they are.
For those of you wondering why I used 2018 instead of 2019, well, I guess it was just because 2018 was a full year!
There’s nothing gained from the 2019 data, but then again, nothing lost in showing it either…
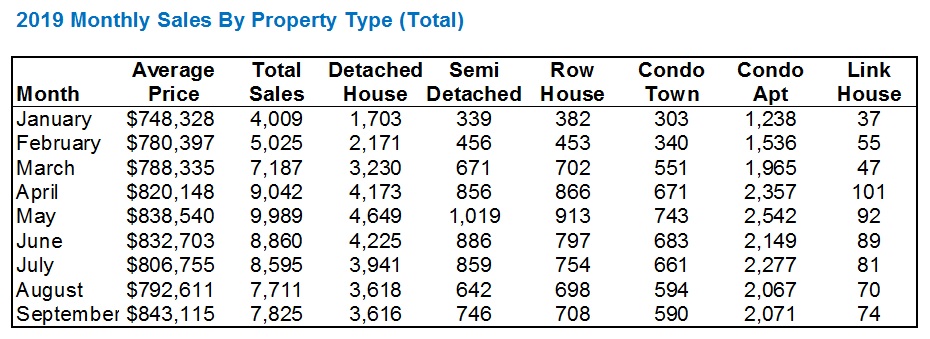
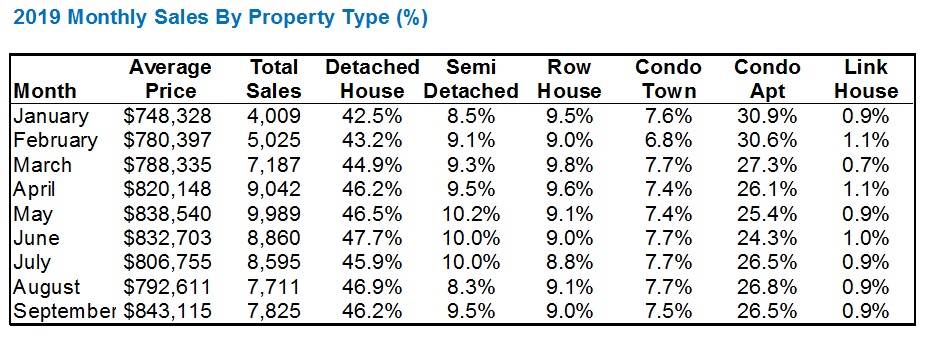
I only have two observations with respect to the 2019 data set, compared to 2018:
1) There are proportionately more sales for detached homes, and proportionately fewer sales for condominium apartments.
2) The “spread” between high and low is about 1% greater for each of detached and condo
Now having been through the spring and fall markets for sixteen years, coming off the heels, both times, of slower winter and summer markets, I can tell you this with certainty: it’s always tougher to buy a home during peak seasons as well.
It might be more expensive, and it might not be, if the theory above holds true.
But coming off a 20-offer extravaganza on Monday night, and even losing on Tuesday night up against only one competing offer, but being told we were “blown out” nonetheless, you’re going to have far more of these experiences in peak season than in slower times.
The reasoning has always been, “You might pay more for a home during peak season, but you get more choice.”
I would agree, but you also have a lot more competition!
Things are heating up out there again after a slower period to finish September.
If this keeps up, I’m predicting an average sale price close to $860,000 for the month of October.


M
at 12:29 pm
When looking at the HPI and wondering if sales mix has any effect on it, why not just then go and look at TREB market watch where they break down average price by property type? 416 detached up 1.2% YoY for example. The more interesting question would be do different types of properties within the same segment sell based on seasonality, e.g. are different location/price points/size of detached houses selling at different times of the year, thus affecting the sales mix within the detached segment.
Derek
at 2:53 pm
Here’s a question. Not sure how far down the rabbit hole it goes. What impact on average price or price index does flipping have? How much starter home stock is converted to move up stock? How many homes are ejected from the stream of appreciating on their merits into the stream of a whole new higher price point? How does that fit into the price narrative?
Professional Shanker
at 10:41 pm
This was a primary argument I had during the run up of prices in 2015 to 2017, the reno flip market was so hot that capex was a large factor in the price increases.
Appraiser
at 12:29 pm
The home improvement / renovation market has been hot for many years now, and show no signs of slowing down. Yes, it is procyclical in nature and contributes to price increases to some degree, and justifiably so, but it is also indicative of long term homeowner and investor confidence in real estate.
Rental rates are justifying the capex for most investors, while pride of ownership and handsome annual price increases are making homeowners smile after spending money on (sometimes much needed) improvements to the house.
It is important to remember that housing contributes to GDP, through an imputed rent formula concocted by Statscan. Investment in the housing stock, especially upgrades and improvements addressing deferred maintenance items in older structures and dwellings, is a long term benefit to the economy.
Derek
at 2:20 pm
I wonder if the percentage of homes that are purchased for the purpose of rebuild/gut-job & flip has experienced statistically significant changes during different periods. That is, if there is a long term average of x% of homes that are subject to the builder/flipper market, has there been any large measurable increases or decreases, during what periods, and to what extent would that information help someone understand markets.
Perhaps it stays in a narrow % range or perhaps there are large variations.
Perhaps it does not matter. Perhaps I just “wonder” to much.
Kyle
at 1:29 pm
I think there is also an impact to house price increases through the supply and demand affects. When people renovate they usually stay in their homes longer (instead of selling) and therefore when aggregated the more renovations there are, the less supply there is.
Since Toronto put in it’s LTT, the number of people choosing to renovate over relocate seems to have increased substantially.
Appraiser
at 6:02 pm
Good observation.