

Once again, apologies to anybody that doesn’t wake up in the morning looking for a reason to open up Microsoft Excel!
This is a lot of stats for a week!
But I can’t help it. I go where the stories take me, and with the market on the rise in the 416 and home prices, in my opinion, about to skyrocket this spring, I want to look at what’s happening through the rest of the province.
Skyrocket. I said that.
But don’t judge me now. Judge me by the end of May or June when we look at 416 home prices. Because when I look at the number of active buyers I have right now, all of whom have zero options on the market, and I think of how many buyers the 72,000 other agents in the GTA must have on their roster, I can’t see any reason why prices don’t escalate in the next 3 1/2 months.
Last week’s game was an interesting test of consumer confidence.
While one reader predicted that it would take until 2029 to surpass the peak average GTA home price from February of 2022, a couple of others suggested that it would happen this year!
I wasn’t nearly as bullish, having made my prediction for October of 2025.
But my prediction is based on the central core of the 416 representing only one small part of the GTA average home price. I think that prices in the central core about to rip and that by the fall of 2023 or the spring of 2024, we could be surpassing peaks for this market. But for the GTA market as whole? I just can’t see some of these areas that have dropped 30% or more regaining their former glory for at least a few years.
So what is happening in some of these areas?
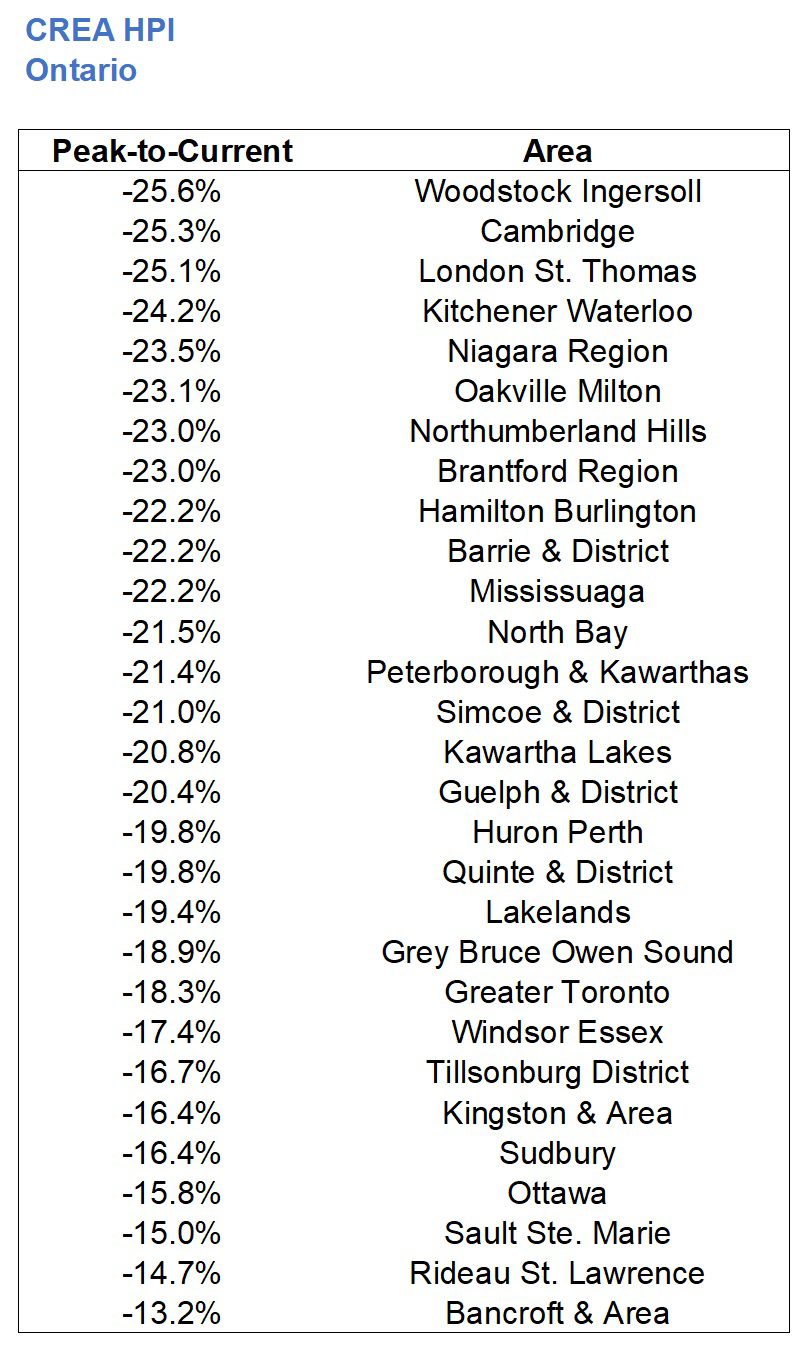
While the Toronto Real Estate Board gives us average sale price data for Toronto, Durham, York, Halton, and Peel, the Canadian Real Estate Association further breaks down the whole of Ontario into twenty-nine regions.
CREA also differs with respect to their metric, as they use a Home Price Index instead of an average sale price. But the HPI is smoother and less volatile than a home price index, so when comparing twenty-nine areas, it actually provides a better comparison
Today, I want to look at those twenty nine areas and see how far each area has moved from the peak.
Some of the peaks were reached in February of 2022, but others were March, April, May, June, July, and one even came in August of last year!
So we’ll use the peak for each area and compare it to the most recently-avaialble data, which is for February of 2023.
How much has the HPI declined in each of these areas?
What are the areas worst hit?
Let’s look at the Top-10 by decline, and just to provide some perspective, we’ll chart each month’s HPI from the start of 2020, that way we can see how quickly prices ascended.
Here are the hardest-hit of the twenty-nine areas…
#1) Woodstock Ingersoll:
Down 25.6% from peak:

Woodstock Ingersoll saw the peak in March of 2022 at $827,700, and prices have retreated by 25.6%, down to an HPI of $616,300.
It’s important to note, of course, that the HPI increased by a whopping 96.6% from January of 2020 through the peak in March of 2022.
The higher they, the further they have to fall?
–
#2: Cambridge
Down 25.3% from peak:

Cambridge saw an 88.9% increase from January of 2020 through the peak, which arrived in February of 2022.
That’s from $421,500 up to $828,700. The HPI has declined by 25.3%, to $742,300.
The decline was a lot steeper, however. Look at the pointed-peak for Cambridge compared to the rounded peak for Woodsock!
–
#3: London St. Thomas
Down 25.1% from peak:
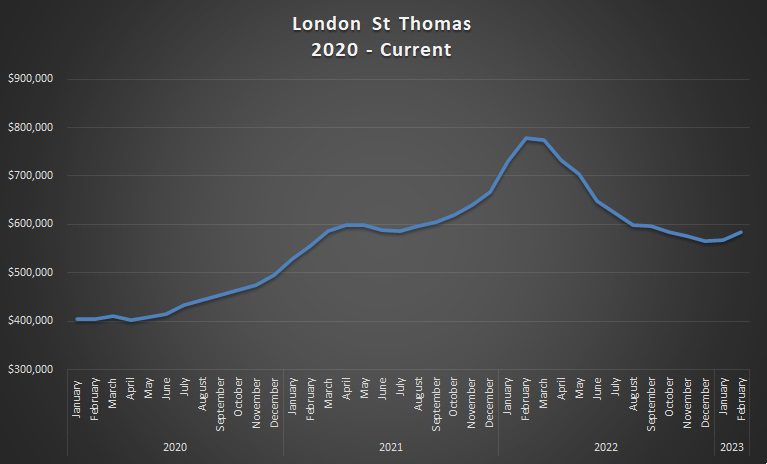
This peak also arrived in February of 2022, which surprisingly wasn’t the most common peak. The most common was actually March, but that makes sense since HPI data is usually lagging.
From $778,900 in February of 2022 down to $583,500 in February of 2023; that’s a 25.1% decline.
The incline from January of 2020 through the peak, however, was 92.9%.
–
#4: Kitchener Waterloo
Down 24.2% from the peak:
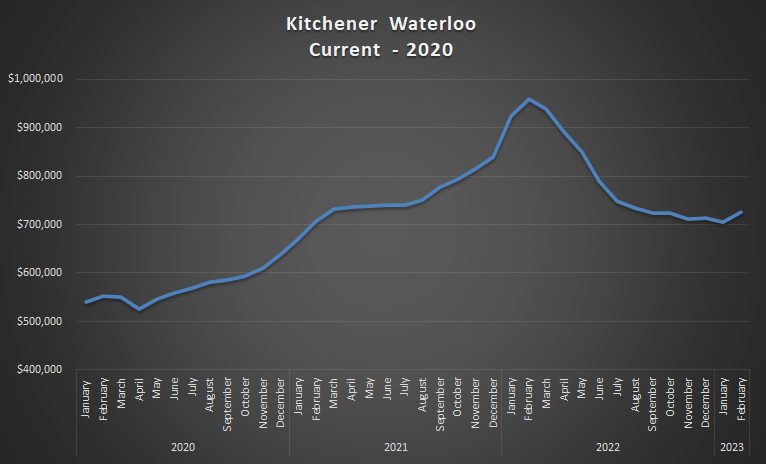
Kitchener Waterloo “only” saw a 77.4% increase from January of 2020 through the peak in February of 2022, which is toward the very bottom of the list. That tells a story, doesn’t it?
The peak HPI in February of last year was $957,900 and that 24.2% decline takes us to $726,500 this past month.
–
#5: Niagara Region
Down 23.5% from the peak:

Fourteen of the twenty-nine Ontario areas tracked by CREA saw the HPI peak in March, and Niagara Region is one of them.
The peak HPI of $820,100 retreated by 23.5% to $627,500.
–
#6: Oakville Milton
Down 23.1% from the peak:
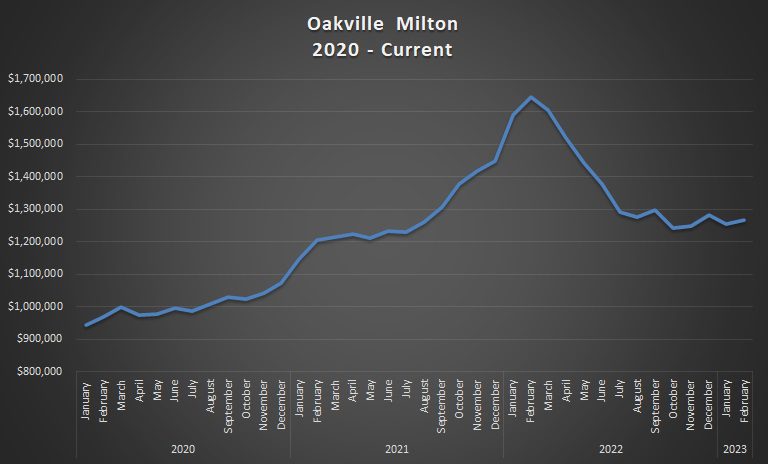
Amazingly, Oakville-Milton placed 26th of 29 Ontario areas when it comes to the increase from January of 2020 through the peak: a “mere” 74.3%
That peak arrived in February of 2022, hitting a high of $1,645,900, before declining 23.1% to $1,266,500 last month.
–
#7: Northumberland Hills
Down 23.0% from the peak:
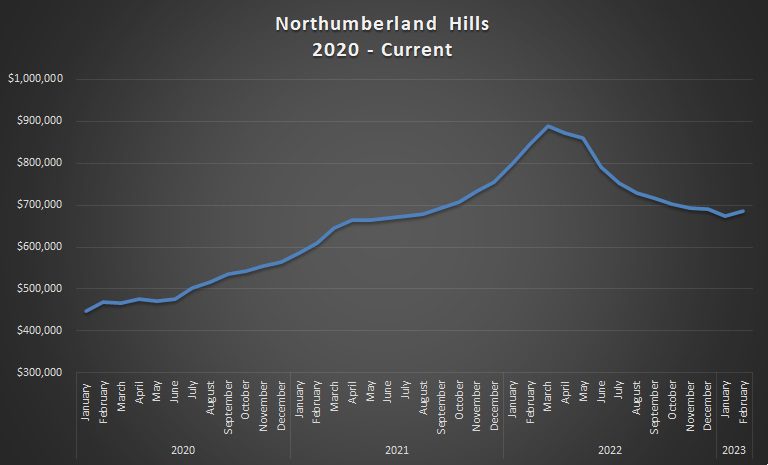
Prices in Northumberland Hills rose a whopping 98.9% from January of 2020 through the “peak,” which came in March of 2022 at $889,300.
The decline was slower at first, as evidenced by that rounded peak above, but eventually the HPI came down 23.0% in total.
–
#8: Brantford Region
Down 23.0% from the peak:

Tied with Northumberland Hills with a decline of 23.0% from the peak, the ascent from December of 2020 through February of 2021 was ridiculous. The line in the chart above is about as close to 90-degrees as you’ll get.
Increasing 89.0% from January of 2020 through the March, 2022 peak, the HPI has declined by 23.0% since then.
–
#9: Hamilton Burlington
Down 22.2% from the peak:
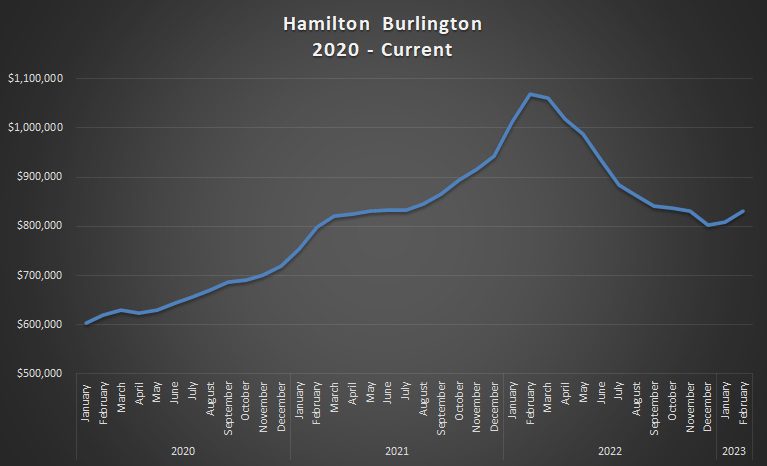
Hamilton-Burlington “only” saw a 77.3% increase from January of 2020 through the peak, which places it 22nd out of 29 regions.
But the decline since that peak is good enough for 9th place, dropping from $1,068,00 in February of 2022 to $831,300 today.
–
#10: Barrie & District
Down 22.2% from the peak:
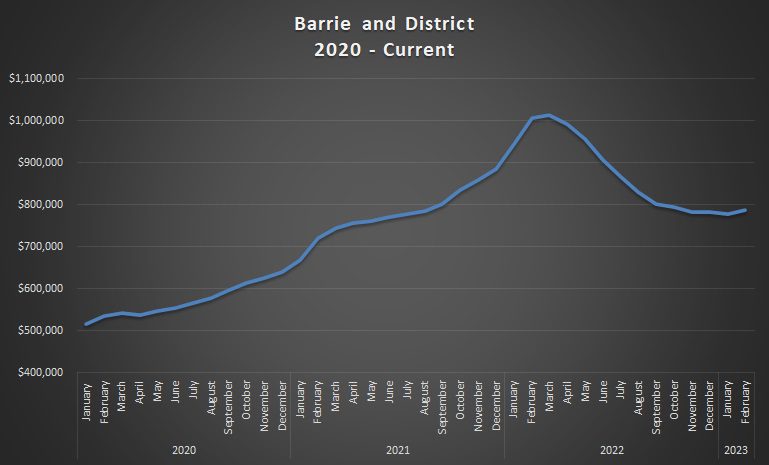
Rounding out the top-ten is Barrie, which also saw close to a doubling in HPI from January of 2020 through the peak; an incredible 96.5% from $515,400 to $1,012,600.
The 22.2% decline in HPI refers to a current level of $787,900.
–
Here’s the full data set in case you want to see which areas have declined the least, although I don’t think we need charts for those:
Using the twenty-nine areas that CREA tracks throughout Ontario, there are a lot of other interesting measures we can look at!
For example, I mentioned the measure of “January 2020 through the peak,” which is fascinating.
Is there any correlation between the areas that skyrocketed up in price and those that fell the hardest?
Let’s take a look:

On the left, we have the increase in HPI from January of 2020 through the respective peaks.
On the right, we have the ranking, out of twenty-nine areas, in the DECLINE from peak to current.
For example, we saw in the first chart that Woodstock Ingersoll has the highest decline from peak-to-current at 25.6%, and thus it ranks 1.
But I’m not really seeing a correlation here.
In fact, Bancroft & Area ranked 29th in decline, and yet it had the 7th highest increase from January of 2020 through the peak.
Is it possible that there’s absolutely no correlation?
I would have expected that the areas that saw the largest pre-pandemic increase might also see the largest drop since then. After all, is there any reason why home prices in North Bay should have risen, according to the HPI data, 116.3% within two years?
But above all, I remain convinced that the “Greater Toronto” region, as CREA has named it, will be among the top gainers from here on out. Not the top gainer, since there are all sorts of people searching for affordability in areas where the HPI is less than half of that of the GTA, and those regions could end up atop the list. But at the risk of sounding like a broken record, I think the central core is about to take off.
I’ll leave it there for now.
And on Wednesday, I want to look at what’s happening across the country, just to put all these media headlines and “Canada-wide” statistics and headlines in perspective…


Appraiser
at 8:53 am
Low inventory you say? Well, one less property on the market for sale over here. We’ve been trying to sell an investment property in Brampton for two months, after the tenant of 7 years vacated to a nursing home.
Plenty of showings and one lousy low-ball offer later, we decided to rent the property out again instead: For $1,100 more per month than the previous tenant was paying.
Average Joe
at 9:58 am
I mean, if you only get one bid I’d say that’s the current market price. It’s been said a thousand times on this blog that houses are worth what someone is willing to pay.
There’s a place a couple streets over that I was very interested in and my interest evaporated when I got home and saw the listing price. They’re 20%+ above what a bigger place five houses down sold for in Dec. There’s probably five good comparables that could dial in exactly what I’d offer them but what’s the point? A bunch of big places on the same street failed to sell or close last year and they’re either empty or rented now. If priced at 70%-80% above the 2019 value they’d all sell, but there’s still a number of listings coming out that have Feb 2022 pricing here.
daniel
at 10:48 am
equally, a house is also worth what someone is willing to sell it for…
Average Joe
at 1:52 pm
You’re describing an unrealized loss in value. I’m sure SVB would have loved to assign their own value to 10 year treasuries. Credit Suisse probably wanted more than 3B to sell. But that’s not reality.
You can bet on whatever future price you want, and hold out for as long as you want. But today it’s worth whatever was bid, exactly like last year.
Appraiser
at 4:42 pm
@daniel: That’s exactly right. We can wait until next spring or the spring after that, especially with the extra cash flow from the higher rent. If there was more housing supply and more competition for renters amongst landlords like me, more of us investors would feel compelled to sell.
There is relatively low inventory, but I feel many buyers are being overly picky, blaming you guessed it – low inventory. Mortgage rates are high relative to market prices and affordability is a bigger issue than ever. It’s not a market where everything is selling with multiple offers. Especially outside the 416.
J G
at 10:56 am
I’m sorry people are not over paying, lower your expectations and you will get more offers.
Also a lot of tenants falling behind in rent these days (intentionally or not), people know there’s 8 month backlog at LTB, good luck to LLs.
Appraiser
at 5:37 am
Nothing to be sorry for. However, if I were so inclined the extra $1,100 per month in cash flow would help to salve the wound.
We may even sell the big house and move in to this particular house, which is a tidy little detached bungalow. Perfect for retirees.
Nice to have options.
Ace Goodheart
at 7:52 pm
Brampton isn’t really Toronto.
I would say most, if not all, of the core “prime” neighbourhoods have fully regained their Feb 2022 price points.
There is no slowdown in the 416 detached and semi detached market.
There is as per usual, almost nothing for sale.
When a house does pop up, it is swarmed. There is a line down the street on open house day. They book showings back to back.
One thing us certain and that is there is NOTHING, hands down nothing, at all, that compares to an investment in a semi or detached Toronto core house.
You make money every year.
Appraiser
at 6:13 am
The house was purchased almost 8 years ago. Hardly an unrealized loss. More like a highly cash-flow positive investment at present.
P.S. The forced sale of Credit Suisse as an analogy is weak and tortured.
Average Joe
at 7:44 am
Well it certainly sounds like you don’t want your highly cash-flow positive investment and neither does anyone else. It sounds more like you missed the window to sell at the peak and you’re trying to avoid the loss in value since Feb ’22. Which is kind of an amature approach if I’m being honest.
There are no low ballers or picky buyers, there is only the invisible hand of the market telling you that your asset isn’t currently worth your ask.
Appraiser
at 12:51 pm
Still takes 2 to tango.
J G
at 8:21 am
Unlike RH or Markham, Brampton is just not desirable.
Maybe the price will catch up later if the price ratio of Brampton-to-rest of GTA becomes really really low.
Appraiser
at 12:55 pm
Rents are at all-time highs in Brampton. Not sure if that helps with the concept of desirability.
J G
at 10:47 pm
No it doesn’t. Rent may be at all time high in Brampton compared to previous rents Brampton. Congrats..
Just like rent is at all time high in Windsor compared to previous rents in Windsor.
QuietBard
at 10:20 am
You might find a correlation with distance from the downtown Core and price escalation. But I wouldn’t think it be significant. Also, some areas might show higher percentage increases than others just because their denominators (starting price) were lower. Could explain why North Bay saw the biggest increase. As for the decline portion, maybe there hasn’t been enough sales activity for the price to “correct”.
I agree and think prices will increase. But that’s mostly because the 5 yr bond yields have fallen. But I will say I think sales activity should pick up since more people can now “afford” properties at the lower rates. Although inventory still seems to be limited.
Ace Goodheart
at 10:33 am
Very true.
Mortgage rates are set in the bond market and are directly related to the yield on government debt. If the yield on govt debt goes down, mortgage interest rates go down.
As we all know, house prices in Canada are set by mortgage interest rates in an inverse relationship.
If mortgage interest rates go up, house prices go down.
So now, with US banks blowing up and the Fed getting cold feet and looking more dovish, and the BoC having done a complete about face, house prices look primed to go back up again.
jerry
at 6:51 am
The Canadian Real Estate Association further divides all of Ontario into twenty-nine regions, while the Toronto Real Estate Board provides average sale price data for Toronto, Durham, York, Halton, and Peel.
Cleaning Services Near Me in Canada
Alexander
at 4:39 pm
My first thought when I saw BoC pausing is they are taking care of their pals to fully utilize the spring mortgage market. IMHO central banks still need to hike higher, including BoC. If they pause now playing chicken, then they will have to start over sooner or later. And that’s when everything is going to be super nasty. So I am not worried about the crazy Toronto spring market, I am worrying about the 10-15% mortgage interest rate in 2 or 3 years. I hope I am wrong. You have to ask yourself what you are going to do if the rates will move higher even before starting thinking to buy a property now.
Ace Goodheart
at 6:25 pm
If rates go to 10-15% it will blow up the banks.
Banks are Federally insured, which means a huge bailout using printed or borrowed CDN$.
So that is not going to happen.
Reality is, the Fed has backed off because they realize further hikes will cause more and larger bank failures, and the government then has to start bailing out broken, collapsed banks.
The 2008 economic crisis is studied in every US economic program.
Everyone knows what happens.
Rates will stay where they are now, unless they go down, and the government will just ignore inflation.
Likely, by the end of summer inflation will be back to around 4% and headed down.