

It’s not quite one of those “where were you moments,” on par with the moon landing, the Kennedy assassination, et al, but perhaps one day I’ll look back at this moment as the point of no return.
Where was I, and what was I doing when I heard that the January, 2022 TRREB stats were released?
I was driving. I was on Richmond Street West. I believe it was just west of Bathurst Street.
That’s when Matthew called.
“The TRREB stats are out,” he told me, last Thursday afternoon, “And they’re……interesting.”
“What is it?” I asked. “What’s the number?”
I didn’t need to specify which number. There was simply no need.
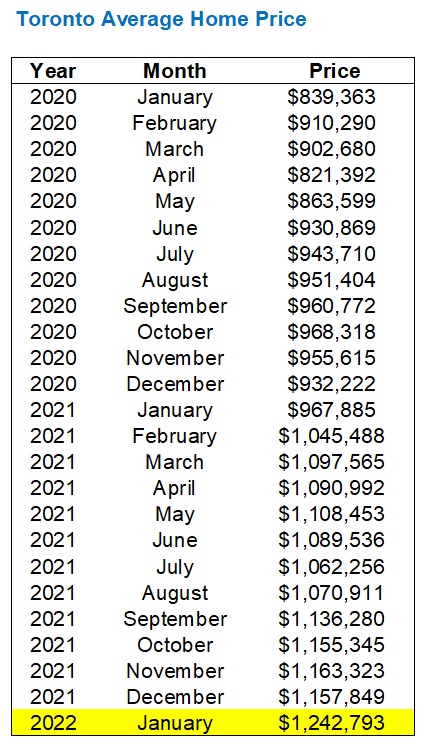
The average home price in Toronto in December of last year was $1,157,849, which was the second-highest of all time, trailing only the previous month, November, which was $1,163,323.
I had this figure, $1,157,849, etched in my mind over the December holidays and into the New Year, wondering simply, “Where can we go from here?”
Let’s not forget, we started 2021 with an average home price in January of $967,884, the last time we’d ever see a sub-million-dollar figure again. So by November, the average home price was up almost $200,000.
So when Matthew called me and said that the January TRREB stats had been released, we all knew that there was one figure we were dying to know, and that’s the January average home price.
Armed with this $1,157,849 figure in my mind, I asked Matthew, “Is it close to $1,200,000?”
“Um, no, not really,” he said, with a little trepidation in his voice.
So perhaps it wasn’t that bad? I was thinking that, with everything going on in the market, maybe we’d see an average home price pushing $1,200,000, but from $1,157,849 in December, that would be nuts, right?
Thankfully, Matthew said, “No, not really,” so I was a bit relieved.
“So it’s, what, barely moved?” I asked. “That can’t be right.”
“No, it’s moved,” Matthew said. “A lot! But what I meant by ‘no, it’s not really close’ is that it’s so far over $1,200,000.”
I paused, absorbed what he was saying, and then slowly responded, “One-million……..two hundred……”
“One-million two-hundred forty-two thousand seven-hundred ninety-three,” Matthew blurted out before I could finish.
Yes, you read that correctly.
The average home price in January was $1,242,793, on the heels of a December average home price that was $1,157,849.
The average home price is up 7.3% in a single month.
Folks, we don’t really want this. Those who own a house or house(s) and will never move again, maybe don’t care, but if they have children or friends and family trying to get into the market, they do.
But I mean that there’s nothing positive or inherently good about an average home price in Toronto that’s up 7.3% in a single month, so don’t take this blog post as any sort of grandstanding. Whenever I’m asked what the market is like, and I say, “It’s crazy,” or some variation of that, people always respond, “Well, that’s good for you, right?” But that’s missing the point of what I do. I transact. I represent buyers and sellers. I work east and west, low-price range and high-price range, houses and condos, and everything in between. So never-ending price increases aren’t “good for me” and I don’t want readers to think that the statistics I publish have a bullish bias.
Let’s take a quick look at the “tale of the average home price” since the start of 2020:
January of 2020 seems so long ago.
It’s tough for many of us to even fathom that’s been almost two years of this COVID-19 pandemic, and that if we lived our real estate lives in a COVID timeline, we’d be saying, “COVID was two years, and $330,000 ago.”
But just imagine an average home price of $910,290 in February of 2020 up against an average home price of $1,242,793 in January of 2022.
Did anybody foresee this?
Against all odds, a worldwide pandemic, job losses, a shrinking economy, and the world social-distancing and staying home, the average Toronto home price has increased 37.7% since the pandemic began and 48.0% since January of 2020, exactly two years ago.
It’s wild!
But if we want to put that January figure in perspective, then we’ll need to compare to previous months of January.
The average home price increased by 7.3% from December to January.
Is that normal?
Probably not, I think that goes without saying. But what is “typical” from December to January? And what would this tell us about this past month?
Have a look:
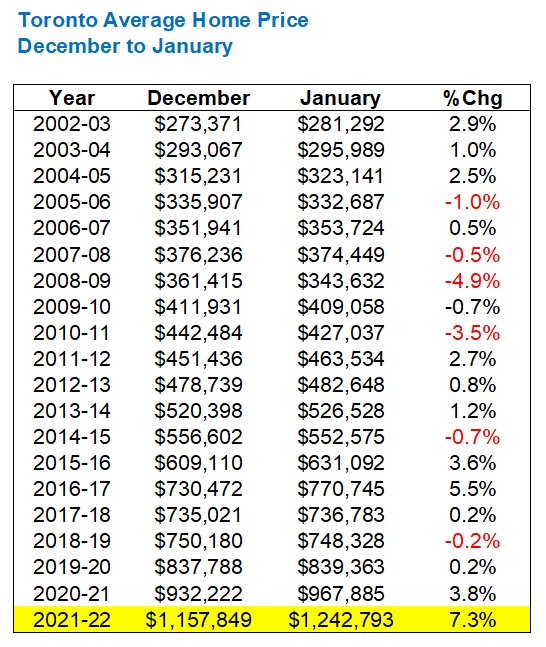
In the nineteen preceding years, there were six times when the average home price actually dropped from December to January, and fourteen occasions when it increased. But the largest increase, before this past month, was the 5.5% improvement we saw in 2017.
2017.
Why does that ring a bell?
Oh, because the first four months of 2017 were previously the most insane market I’ve ever worked in.
Only one month into 2022, and I’m already calling this the “new most insane.”
If you were to average the percentage-changes from 2002-03 through 2020-21, you’d arrive at +0.3%. That’s the average change in average home price from December to January in all those years.
So put that up against the 7.3% increase in 2021-2022, and I think it paints a pretty good picture of where this market is.
Some might argue that the December-to-January comparison isn’t fair, since December is often a seasonally-affected month.
I might counter-argue that so too is January, but having said that, what if we took a “fall average?”
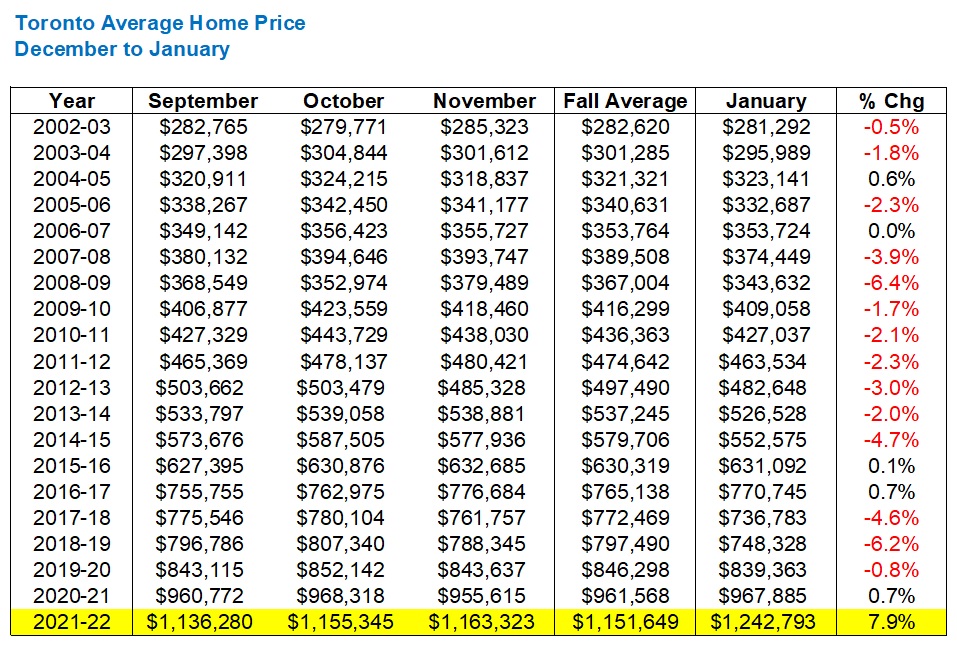
September, October, and November are what make up “the fall market,” so let’s re-run the above analysis, but instead of comparing January to the previous December, we’ll compare it to an average of Sept/Oct/Nov:
This is rather telling.
This time around, instead of only six negative figures we have fourteen.
That’s 14 times in 19 years that the January average home price has been less than the average from Sept/Oct/Nov.
The average of those 19 years is -2.1%.
So, once again, put this year’s +7.9% in perspective!
To see a January figure higher than the average of the previous fall is quite rare, ie the odds are apparently 4/19, but to see a 7.9% increase is just unimaginable.
So in terms of the December-to-January increase of 7.3%, where does this rank all time?
Let’s look at the top-fifteen largest month-over-month increases in TRREB history:
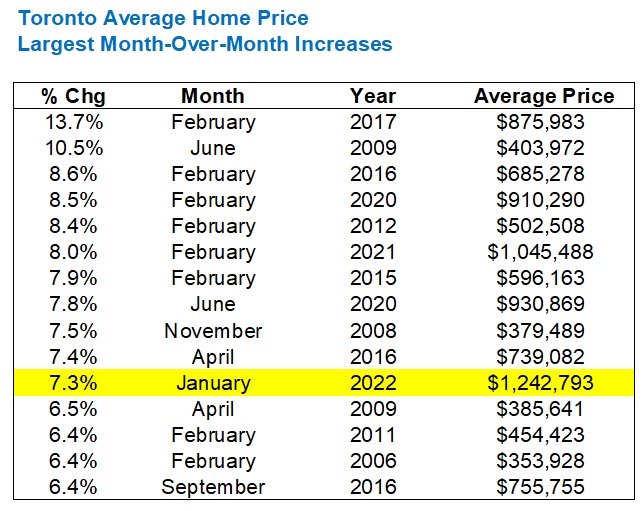
January of 2022 ranks 11th all-time.
But do you see what I see?
February.
Six of the largest seven month-over-month increases of all time happened in February.
Is there any way this trend will continue?
I think back to that phone call from Matthew, in the car on Richmond Street, hearing about an average sale price of $1,242,793. Surely there’s no 8-9% increase coming this February, right?
So let’s look at the sales data and figure out why we saw this huge increase.
We know that listings are scarce, demand is high, and competition is everywhere, but what does the data show?
I wanted to re-run that December-to-January comparison for sales just to see where we’re at:
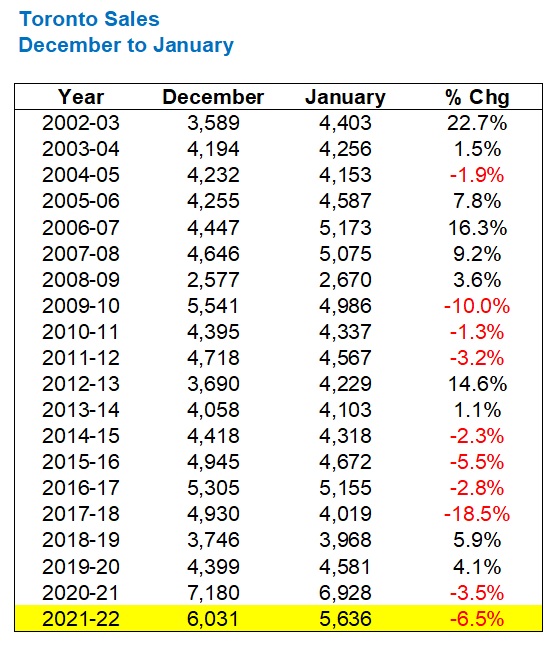
Sales dropped 10 times in 20 years from December to January, so to see a 6.5% drop this January is nothing special.
To be honest, I do not take any conclusions away from this data set, but to not look into it would be irresponsible.
But from here, can we look at perhaps why there’s no conclusion to be had? Maybe we’re looking at the data all wrong?
We want to know what the sales data is telling us about price.
If supply is low and demand is high, then prices increase. So maybe looking at sales figures from December to January is not going to tell us what we want to know, since comparing December-to-January in previous years ignores the relationship between supply and demand.
In actual fact, we need the sales-to-new-listings ratio from those years, and not the change in total sales from January to December…

Ah, right!
That looks telling!
The SNLR of 71% actually trails 2020, which is shocking, but if we consider the craziest spring markets we’ve ever had, I’d say 2017 and 2021 were them, along with, thus far at least, 2022.
I will say that to see 58% in 2020 was surprising, since that was a really tight market! The condo market in the downtown core, especially, but this data is for the GTA, let’s not forget.
Speaking of which, what does the data look like by district in the GTA?
We know that the average home price in Toronto (GTA) increased month-over-month by 7.3%, but can that be applied across the board? Did your downtown Toronto condo go up in value at the same pace as that Ajax townhouse?
No, not even close.
In fact, if you break down the numbers by TRREB district, you’re feeling short-changed if you live in the City of Toronto, and you can’t believe your eyes if you live outside the core:
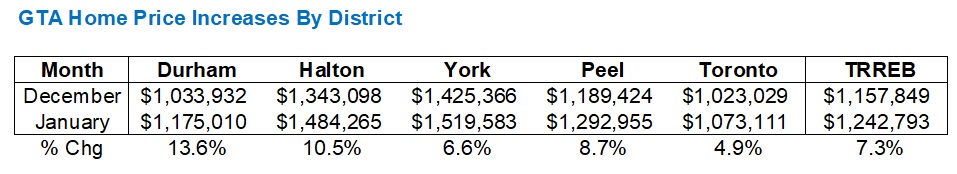
Imagine the average home price increasing $142,000 and change in Durham Region……in a single month?
Most of you are simply refusing to believe this statistic. I understand that.
“It has to be a sample-size error,” you tell yourself.
“You can’t take a month-over-month stat without adjusting for seasonal bias,” you argue.
Tell yourself whatever you want, I don’t blame you. It’s just impossible to accept on face value that a $1,000,000 house in December is “worth” $1,136,000 in January.
However, it’s areas like Durham Region where we see why the GTA average has been skyrocketing over the last few years, and it’s because people are no longer looking at any factor other than absolute price.
What do I mean by that?
You probably wouldn’t want want to buy “some guy’s” condo for $600,000 if you knew he paid $470,000 for it last year. You’d back would get up. You’d be on the defensive. You’d make it personal.
In Durham Region, buyers are saying, “So, let me get this straight: I can buy this 4-bed, 4-bath, 3-year-old house for $950,000, which would cost me $2,500,000 in North Toronto?” And they don’t care what this house was worth last week, last month, or last year. They just care that they can get it for $950,000.
Tell that buyer, “This house sold two years ago for $525,000,” and that buyer doesn’t care.
That buyer only cares what he or she can buy this house for today, and that’s it!
I should also mention, sadly, that my example above – about a $950,000 house in Durham Region, today, costing $525,000 two years ago.
Think I’m joking?
Let’s re-run the figures above to look back 24 months:
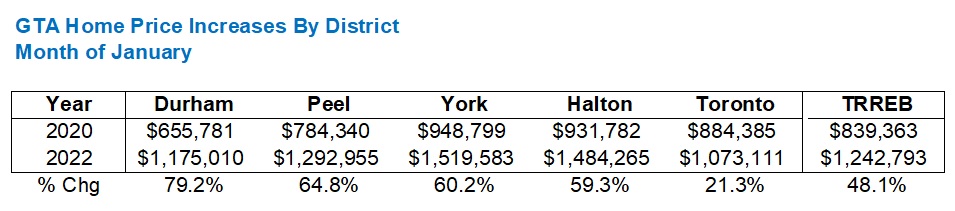
What’s more shocking: that Durham Region is up 79.2% in two years, or that Toronto-416 is only up 21.3%?
This is why some people looking to move out of the 416 and into larger houses in York Region or Halton are having trouble. They’re chasing the market, as the gap is widening, and many don’t want to believe it. I had this very conversation with a couple on the weekend who own an incredible detached house in the central core, and who are watching the spread between the value of their house and the value of the house they want in York Region grow larger and larger every month.
So, what’s the conclusion here?
What can we take away from the January TRREB stats?
Well, folks, I think we’ve reached the point of no return.
I don’t see this market changing, at least not significantly. The absurd heat of January may subside as we get into April and May, but we’re not going to see a 2017-like drop in prices, as the government likely isn’t going to step up to a microphone and single-handidly crash the market as they did five years ago. Buyers everywhere outside the central core have now shown they are fine to pay what it costs to get a house in Whitby, or Richmond Hill, or Maple, or Port Credit, and there’s no shortage of demand.
I know that so many people want, so badly, to see some sort of crash. If the average home price dropped a “recession-like” 30%, we’d be back to January of 2020 prices. That doesn’t bode well for your buddy at work who’s been predicting the crash since you met him in 2012.
I’d love to see more stability in the market. I’d love to see more balance.
But it’s not happening just yet.
More inventory, higher interest rates, exhausted buyers, focus on summer and post-COVID life, and a lot of buyers who have already purchased in winter/spring exiting the buyer pool, all could combine to produce “balance” by early-summer.
Can all of that happen at once?


Appraiser
at 8:34 am
Whether virtuous or vicious, depending on ones personal perspective I suppose, the current housing cycle is proving very difficult to disrupt.
One of the reasons is that continuously higher prices bring greater and greater equity to existing homeowners. Rising equity spawns larger and larger HELOCS for these same homeowners, many of whom have little or no mortgage. Some of this cohort are now assisting in the purchase of real estate for their kids and grand kids.
“What Were Once Vices Are Now Habits” ?
Bal
at 2:07 pm
what happened to your white flag ? …lol
Average Joe
at 2:46 pm
I was having this conversation last night with the wife. This has become a perpetual motion machine. The more you bid on the next property, the higher the comps, the more access to equity on your current property and everyone else’s.
I should start dropping thank you notes off (maybe some good wine or champagne) to all the crazy buyers in my area.
Bal
at 3:24 pm
lol….so true ….suddenly my parents house is 2.8 million …..from 1.1 million …..lollol
JK007
at 3:52 pm
there are only 2 ways this will stop:
1. Immigration stops completely hence no new renters to live in the investment properties
2. interest rates rise to more than 5%..
Since neither is possible in totality what we would get is a plateau probably at some point of time rather than a decline..being reminded of India where folks would either live in company accommodation or rent and save their entire lives before moving in their apartments/homes post retirements unless you came from money and if that was the case then one could buy and sell on drop of a hat into swankier abodes…wondering if we see the same thing here in near future when Freehold HOUSE ownership would truly be a luxury and majority will either rent or at most stay in a condo.
Bal
at 4:00 pm
but Condo are also not cheap .:.:million dollar condo sold in milton…..
JK007
at 9:51 am
and that’s why people will save entire lives to move in one if able to and leave them to their kids to live in and keep paying it off..
Mike Stevenson
at 6:55 pm
“Stock prices have reached what looks like a permanently high plateau.” -Economist Irving Fisher, one week before the 1929 stock market crash.
JK007
at 9:58 am
Back in 2006 I bought a 1900sq ft condo in a suburb of Delhi for approximately 80K CAD in today’s money..by 2013 was being offered approx 170K CAD and curiously today it could fetch approx 150K CAD..reason why prices went down were three fold..interest rates spiked to over 10%, rise in unemployment post 2008 crisis and finally massive apartment/condo buildup in the suburbs in 100s of thousands some of them still incomplete or mired in legal cases for illegal construction or builders going bankrupt leaving people in limbo…
Point being if property prices are to go down either you remove demand (less immigration, higher interest rates) or massively increase supply (don’t see that happening)
Mike Stevenson
at 1:19 am
For what it’s worth, I think these things usually peak and go down when it’s extremely hard to foresee it happening. The reasons will be clear in hindsight.
I’ll say this much. The boomers aren’t getting any younger.
Mike Stevenson
at 6:28 pm
People only think they want a crash. When it actually happens, they won’t be buyers. They won’t have the money or won’t want to risk the money because their personal economy is shaky. Crashes don’t happen in isolation. Your stocks go down or your job becomes imperiled or other things happen that make the proposition of purchasing an 800 thousand dollar item different than it seemed 6 months earlier.
What’s going on right now is a classic blow off top, imo.
Keith
at 12:17 am
SFH in Vancouver is freezing up. The baby boom generation knows if they sell, they could be shut out forever. Tear downs on a standard east side lot start at 1.5. Move in ready and dated, pushing 2 million. Renovated are well over 2 million. Nice east side neighbourhoods are seeing 3 million dollar price tags, I’m talking Fraser Street – not even Main.
I just spent a couple days at Michael Campbell investment conference. The parts that weren’t about NFT’s and crypto were all about inflation and how to protect yourself. The average person is voting for real estate. At least you can live in your house. No one was predicting a correction, much less a crash. Let’s face it, in the worst case scenario I’ve seen predicted we’re only seven BOC rate increases away from a mortgage rate of … 3.5 percent for five years. In two years. How low is that by historical standards?
I don’t see the necessary political courage to crash the market, and people who live in hope of rich homeowners getting their comeuppance would not thrive in the economic aftermath of a real estate meltdown – it would turn into a crash of everything. Far too risky for any political party.
The real estate market has become too big to fail. Not economically, but politically. Sadly over time, most of us will be the poorer for it.
Condodweller
at 11:52 am
“The parts that weren’t about NFT’s and crypto were all about inflation and how to protect yourself. The average person is voting for real estate.”
This would make sense for a renter IF they can afford to get in the market. As an investment it’s another story though. You need tenants and increasing rents to support the expenses. Did they happen to mention where the money was coming from to support higher rents to sustain The investment? Or are they banking on pure price increases?
I’m starting to see the internet financial advisors starting to recommend protection against high inflation in the form of buying precious metals.
Keith
at 1:52 pm
There are many ways to participate in the real estate market. REITs, for a start.
Condodweller
at 6:24 pm
No kidding, but the discussion here is on buying your own property
Condodweller
at 12:42 pm
Looking at housesigma I see about 50 condos sold last month under 600sqft and over 700k. Each unit was either on a very high floor, had parking, had a den, or a really nice renovation/stage. The ones closer to 800k had multiples of these features. The majority are still under 700k. While prices are trending up a bit I don’t see much difference from before. Let’s see what happens on the condo front in the spring market. For now, despite reports of multiple offers I don’t see runaway prices.
My indicator for improving downturn condo prices will be when average units go above 700k.
Bal
at 4:55 pm
are you only reviewing downtown condo ?
Condodweller
at 6:23 pm
Yes, that’s what I’m interested in and I have a reference point as I have done this search before. I believe I posted it here as well.
G
at 1:38 pm
I’m watching the same market segment, and agree with you, Condodweller, about the 700K mark. But this market segment has risen sharply during the past 3 weeks, at about 70K-80K increase per unit. And it may reach the 700K mark in March or April.
nothing is learned from the past
at 8:44 pm
Bubbles go parabolic as they approach the end. But it will keep on surprising to the upside until eventually the absurd realization sets in that a tulip cannot possibly be worth that much and there are no more buyers left to lure into the pyramid. Psychology turns and the fantasy falls down. Have your parachute ready.
Bal
at 7:09 am
no no this time is different ….lots of immigrants and interest rates will never go that high …only .25 or .50 basis…..many buyers are ready to jump in the market ….so no bubble
Jeff
at 9:19 am
There is always a grain of truth that drives the narratives of bubbles. Then they extrapolate beyond all reason. At this stage fomo and investor mania has taken the reins. Valuations are no longer relevant. This one is no different.
Marty
at 2:58 pm
“Point of No Return” is the title of the second single taken from the Nu Shooz album Poolside. The song spent one week at #1 on the Billboard Hot Dance Club Play chart in September 1986.
And was better than their biggest hit, “I Can’t Wait”.