

“Steady as she goes.”
It’s one of those songs that I know the words to (or at least the chorus…) but I couldn’t, for the life of me, tell you who sings it.
I just looked it up: it’s The Raconteurs.
I’ve never heard of them, so of course, I ended up deep in a Wikipedia rabbit hole, and low and behold, the lead singer was none other than Jack White, who of course is best known for his band, The White Stripes.
But more surprising was that Jack White and The Raconteurs were active after The White Stripes.
I swear the last twenty years of my life are a blur. They’ve gone by so fast it’s crazy, and when I think that “Fell In Love With A Girl” by the White Stripes was released twenty years ago this week, it sure makes me think…
“Steady as she goes.”
The exceptional music video, I must say. I just spent the last twenty minutes here in my office procrastinating, watching White Stripes music videos and downloading MP3’s – yes, for real, I still do that. How else could I burn them onto a CD to play in my Sony Discman?
“Steady as she goes.”
While Jack White put music to the phrase in 2005, the saying or idiom originates from sailing or steering a ship.
“Steady as she goes,” back when ships were referred to in the female turn of phrase.
“Steady as she goes,” describing someone or something that is progressing in a stable and predictable manner.
And if I had to use a phrase to describe the current state of the Toronto real estate market, well, you know where this is going…
In my eNewsletter last month, I wrote the following:
I do think we’ll see 10,000 sales in June, but much of that depends on the strength of the condo market. The average 416 condo sale price dropped from $727,137 in April – the all-time high, to $716,976 in May, so prices are holding steady.
New Listings are going to skyrocket in the month of June as we see re-lists happening with an increasing frequency. By the time we review the June stats next month, we’ll see a Sales-To-New-Listings ratio that plummets, as the surge in new listings skews the data.
As for price, I didn’t specifically mention this in my eNewsletter but mentioned in blog posts that the average sale price “should” come down in June, from May.
So let’s dive into the data, shall we?
First and foremost, I want to check each major June statistic and compare it to May:
AVERAGE PRICE:
June, 2021: $1,089,536
May, 2021: $1,108,453 -1.7%
SALES:
June, 2021: 11,106
May, 2021: 11,951 -7.1%
NEW LISTINGS:
June, 2021: 16,189
May, 2021: 18,586 -12.9%
ACTIVE LISTINGS:
June, 2021: 11,297
May, 2021: 12,253 -7.8%
–
Well, alright then.
Everything is down from May to June!
Prices are down, sales are down, but so too are new listings and active listings.
New listings are down more than sales, so does that mean that demand is higher than supply, on a relative basis? More on that in a moment.
For now, I want to look at the other statistics, month-over-month, just to see how the trend continues:
416 AVERAGE SALE PRICE:
June, 2021: $1,079,749
May, 2021: $1,116,736 -3.3%
416 DETACHED:
June, 2021: $1,699,881
May, 2021: $1,716,272 -1.0%
416 SEMI-DETACHED:
June, 2021: $1,267,044
May, 2021: $1,326,153 -4.5%
416 ROWHOUSE:
June, 2021: $941,474
May, 2021: $945,893 -0.5%
416 CONDOMINIUM:
June, 2021: $717,466
May, 2021: $716,976 +0.1%
–
Once again, we see that virtually everything is down! Well, condos not so much, but a 0.1% ‘increase’ isn’t much to hang your hat on.
The GTA average sale price is down 1.7% but the 416 average is down 3.3%. Surprising to you?
416 semi-detached are down 4.5% but detached are only down 1.0%? Doesn’t this usually work the other way around?
As I always say, “You can make statistics say anything you want to.” So to avoid any incorrect conclusions here, I want to look back at historical data, from May to June, and see what the market “usually” does.
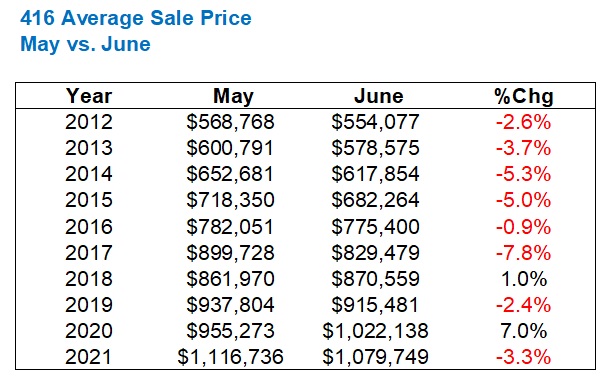
Let’s start with the average sale price:

I usually only go back ten years, but over the long weekend, I spent a lot of time adding data to my running spreadsheet, and voila!
A word of caution: do NOT look back in hindsight here. I know it’s tempting to say, “Oh my word, look at the average price in 2002,” but how old were you back then? Even Jack White was only 27-years-old!
So in a twenty-year cycle, only four times has the average home price increased from May to June, and one of those years was the 2020 pandemic when prices bottomed plummeted in April and then climbed back, so who knows what this figure would look like if not for the pandemic.
For those playing along at home, 16/20 is eighty percent.
So should we simply have expected the average home price to drop from May to June?
Yes. And I alluded to as much last month.
Now, how does that 1.7% drop this year look on a relative basis?
Well, the average monthly change is a decline of 0.6%, however, if you remove the 2020 outlier, the average from 2002 through 2019 is a 1.0% drop.
Either way, we can conclude that the drop from May to June was “larger than usual.”
$1,089,536 is still 17% higher than the $931,131 recorded in June of 2021, which at the time, was a new record for a single month in Toronto, coming merely two months after theTRB readers and I were talking about how many years it would take, post-pandemic, for the average sale price to move back over the $910,290 recorded pre-pandemic.
Wow, time flies!
$1,089,536 is also the fourth-highest single-month ever, behind March, April, and May of 2021.
Is there really that much of a difference between these figures?
March: $1,097,565
April: $1,080,992
May: $1,108,453
June: $1,089,536
–
A glass-half-full approach to these figures is to suggest, “This demonstrates consistency. Four months at this level and it’s not an outlier; this is the true average in Toronto.”
Now, what of sales in June, versus May?

In the previous twenty years, only six times have we seen sales actually increase from May to June.
And again, that includes the ridiculous 88.9% pandemic-induced figure from 2020.
So with sales declining in 14/19 years, prior to 2020, we should have expected a decline this month.
Excluding 2020, the average May-to-June decline is 5.7%, so as with sales, we’re seeing a larger-than-expected change on a month-over-month basis.
Personally, I’m not surprised by this. The market was so damn hot for the first five months of the year that a slightly higher decline than normal seems about right.
When you look at sales, you simply must look at the other side of the coin: listings.
If sales are up, and listings are down, prices are going to drop, and vice versa. It’s as intricate a relationship as your marriage, let me tell you.
So with new listings down 0.1%, year-over-year, when I said last month, “I expect new listings to skyrocket,” how does that 12.9% decline from May look, historically?

Wow, we’re going to have to make excuses for 2020 every single time we run the stats from now on, aren’t we?
Excluding the pandemic year, we’re seeing new listings drop from May to June, every single year. That includes 2017 when the market flooded with new listings after the Liberal government’s announcement and the subsequent drop in activity, but even that year, listings still dropped from May to June.
The average decline from 2012 through 2019 was 13.9%, so the 12.9% drop last month is in line.
So far, everything seems to be doing what it’s supposed to!
What about active listings?
Let’s have a look:

Here’s where there is far less predictability.
Keep in mind that active listings are simply the number of listings on the market at month’s end, so this stat has more to do with absorption of inventory. If there’s a higher proportion of sales in a given month than new listings, then active listings will go down.
Six out of the past ten years have seen active listings decline from May to June, but one of the four years where this did not take place was in 2020.
The 7.8% drop in active listings from May to June this year represents the largest drop in the past decade.
Last but not least, I want to go back to price and look at the change in average prices in each of the individual segments. Since the GTA average sale price declined by 1.7% from May to June, we know that most of the individual segments will be negative as well.
But how much? And how does that compare to previous years?
First, let’s look at the 416, which we mentioned at the top but didn’t analyze:
It seems as though the drop from May to June is common, but so too is the higher drop in the 416 compared to the overall GTA.
The 3.3% drop in the 416, compared to the 1.7% drop in the GTA tells us that the 905 was likely flat and thus balanced out the equation.
Now let’s look specifically at the 416…
First, detached:
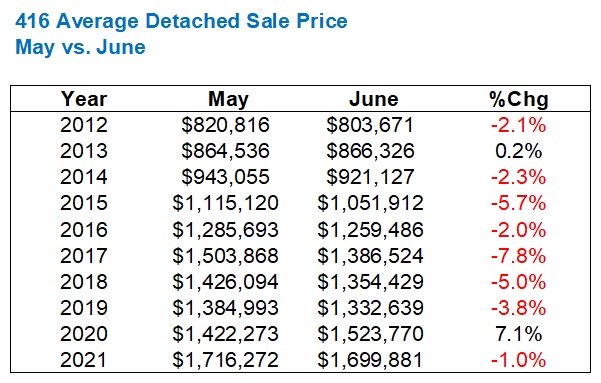
Shocking!
As is the trend, the average detached sale price declines. But a modest 1.0% decrease is actually way below average! From 2012 to 2020, we saw an average decline of 3.6% month-over-month.
Is it possible that the detached segment is the strongest in the 416 right now?
Well, if that were true, we’d be seeing a larger decline in the semi-detached segment.
Right?
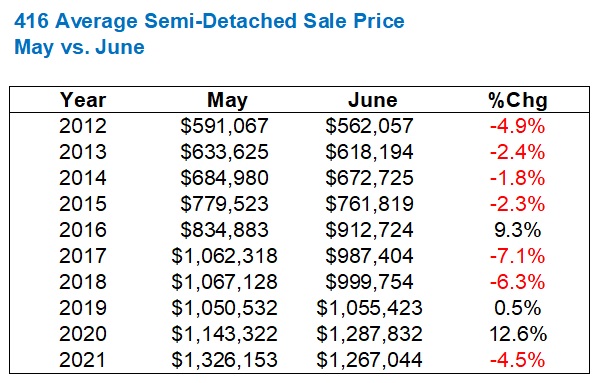
Precisely as expected: a 4.5% decline.
Removing the 2020 pandemic year, we still saw a modest increase in 2019.
2017 and 2018 saw larger declines: 7.1% and 6.3%. But then the prior year in 2016 saw a massive 9.3% increase.
I used to think the detached segment was the most volatile, but this data shows that semi-detached can be unpredictable.
As for condos, we know that the average 416 condo price actually moved up by 0.1% last month, but how does that compare historically?
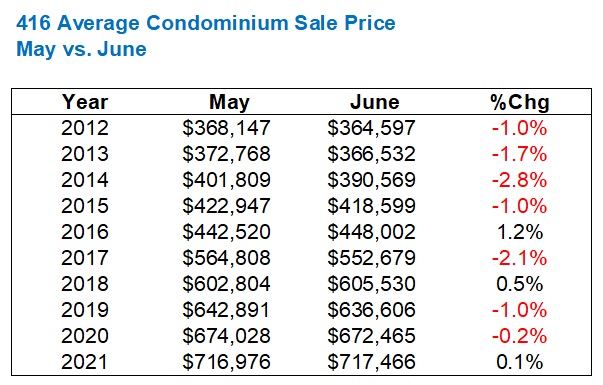
Seven of the last ten years saw the average condo price decrease from May to June, which ironically includes 2020.
I’m shocked by the strength of the 416 market in the condo sector right now. From what I’ve seen, downtown units aren’t moving as quickly for as much money.
–
So what’s the conclusion on the month of June?
“Steady as she goes.”
I honestly can’t think of a better way of summing it up.
Where we will see a massive difference, however, is in the summer market!
Consider that last July and August were basically the hottest on record. All that pent-up demand and those lost sales from the pandemic-affected months of March, April, May, and June led to a frenetic summer.
I expect this summer to be slow. Not just slow compared to last year, but slow compared to the last decade.
I have a few clients who recently decided to list after Labour Day instead of during the month of August, and I suspect a lot of other would-be sellers will make the same decision.
Now, for your viewing pleasure…


Sidegig
at 10:15 am
Semi and rowhouse were actually up June vs May as your data shows, not down, so only 2 out of the 5 categories were down. Also it indicates May 2020 compared to June 2021, thought it should be May 2021 vs June 2021?
David Fleming
at 10:51 am
@ Sidegig
My mistake, all those “May 2020” were supposed to say “May 2021.” And I reversed the semi and row stats.
Phew! That’s not like me but I appreciate the head’s up – thank you!
Verbal Kint
at 11:23 am
David, we get it. For you, the time/money trade off favours ripping off musicians instead of buying their tracks on iTunes or getting a music subscription service. But it’s nothing to brag about, and it sure doesn’t scream “successful broker.”
Steve
at 12:25 pm
MP3 is just a file format, contrary to popular belief there are still legitimate ways to get music in this format. Meanwhile I’m not sure what about your own interactions on this blog suggest successful anything…
ChT
at 12:34 pm
Who’s “we”? Speak for yourself. I’m sorry your life sucks tho… you musician supporting, mega-successful keyboard warrior.
Appraiser
at 1:06 pm
Great data once again David.
Looks like the GTA real estate market is right back where it was before Covid 19.
Under-supplied and over-demanded.
Bal
at 7:23 pm
Moving to Calgary…Goodbye Gang…God Bless…
So many name omg
at 5:39 pm
As a young person in this market… It’s steady as she blows…