
Any parents in the room this morning?
I think you’ll relate to this…
My son is six years old. Every time we get in the car to go somewhere, or even when we’re in the house just talking about going somewhere, he always asks the same question:
“Are we going on the highway?”
I’m not entirely convinced that he knows what a highway is, but he seems to draw a connection in his mind between a “highway” and a “long drive.”
He hates long drives. What child doesn’t?
On shorter drives, and when we’re going slower, he likes to roll the window down and put his face out the window, just like a dog.
Exactly like a dog. In fact, I’m convinced that my son might be 1/8th dog.
But he has this aversion to “the highway,” even when we’re going somewhere that he wants to go.
You parents are familiar with Monkey Vault, I’m sure.
I mean, is Allen Road really a highway? I might have lied a little bit last weekend when I said, “Don’t worry, bud, we’re not taking the highway.”
Of course, that meant he figured he could put his face out the window, and that’s always a challenge when you’re driving a buck-twenty, but I digress…
When we were kids, the cliché quote associated with traveling in cars with our parents was always, “Are we there yet?”
Back then, we knew where we were going!
Today, with my children, at least, it seems that even if they know where we’re going, they’re more concerned about the length of the journey itself. Sure, the end goal might be Monkey Vault, Happy Planet, The Bubble, Liliput Playhouse, Sky Zone, Fun Town, or some other establishment that makes me wish I were in the office on a Sunday morning instead of nursing a large coffee and dreaming about life before children, but the point is: my kids aren’t as concerned with the end result as they are with the process.
Sound familiar?
When I look at the real estate market that existed 5-10 years ago versus the one we find ourselves in today, there are a lot of differences and distinctions, but a unique one comes to mind.
Back then, we simply accepted that the market was going up. That was it. That was normal. We never asked, “Are we there yet?” because we figured that the journey was never-ending. We were simply on a rocket to the moon.
Today, and over the last four years, the perspective is entirely different.
In this market, there’s far more “Are we there yet?”
But where is “there”?
Nobody really knows, and yet we continue to indirectly ask ourselves this question all the time.
Are we looking for market bottom?
Are we searching for some sort of new normal?
Are we simply looking for “there” to be represented by a level of clarity in the market that we haven’t seen in a while?
What in the world are we looking for?
Perhaps it’s just an understanding. With all the uncertainty in the city, our country, and the entire world, perhaps, just once, we’d like to have a clear understanding of where this real estate market is going.
Are we there yet?
Let’s find out…
The GTA average home price increased by 1.8% last month, from September to October:
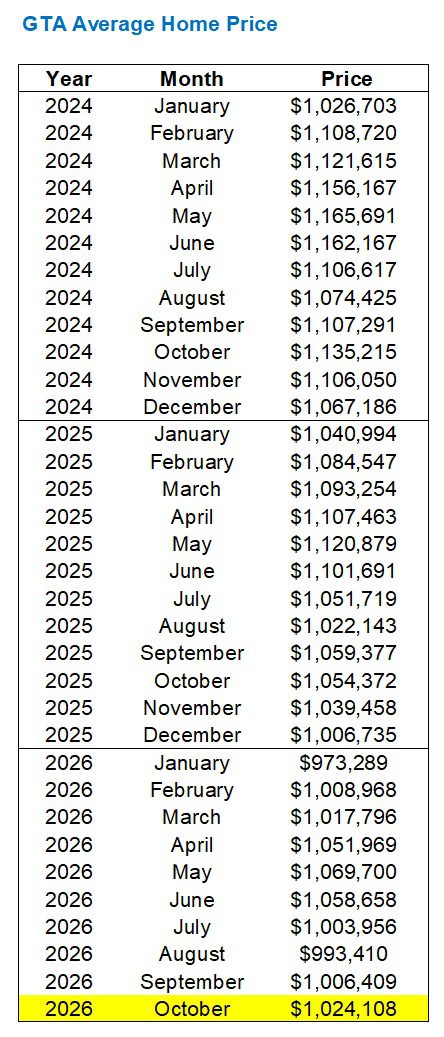
Maybe not much to write home about?
After all, the average home price on a year-over-year basis was still down by 2.9%.
So why the fuss about month-over-month?
Well, if I’m being completely honest, I felt that we might see a decline in average home price in October. I’ve written this in a few spaces over the last several weeks, and I also surmised that total sales volume would look quite poor as well.
I would also add that, in 2025, we saw a decline in the average home price from September to October, which was a major outlier, as the following chart shows:
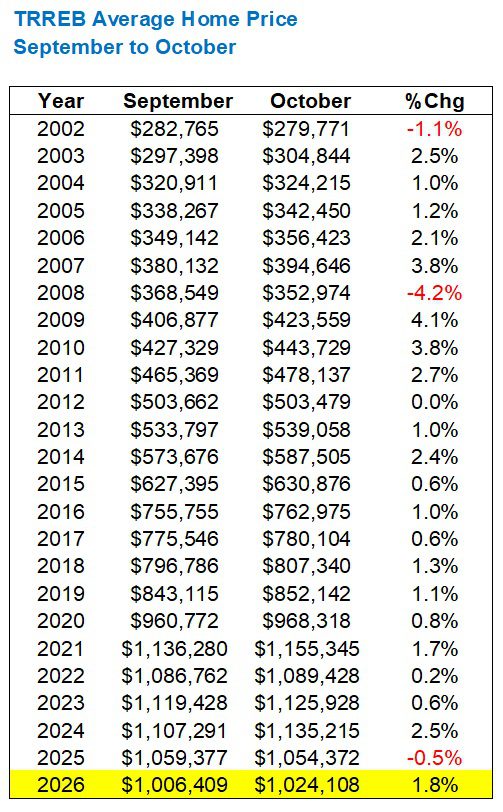
Before 2025, we had only seen a decline in average home price from September to October twice in a period of twenty-three years. One of those periods was in 2008, just after the Financial Crisis, which makes perfect sense.
The fall market builds momentum as we move through September and October. We fully expect that both average home price and unit sales would be higher in October than September, and yet in 2025, we saw that decline month-over-month.
I realize it’s only 0.5%, but it was still significant, as it underscored how tough the market was last fall.
To have avoided a similar decline in 2026, especially considering the economic and political events we’ve experienced in the last two months, is downright shocking to me.
I would have bet that we’d see a decline in average home price from September to October.
And I would have been wrong.
Now, as far as that year-over-year figure is concerned, the 2.9% decline is actually quite positive:
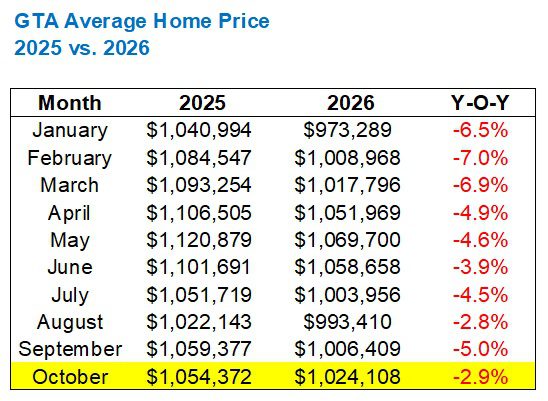
As I wrote in this space last month, we had seen the gap between 2025 and 2026 narrowing as we moved from winter, through spring, and into summer.
But in September, the gap widened, from 2.8% in August to 5.0% in September.
That gap has now narrowed once again, and it will be interesting to see how this chart looks when we’ve updated for November.
Our three-year chart still shows a pretty obvious overall market decline, with one year below the next, and so on…
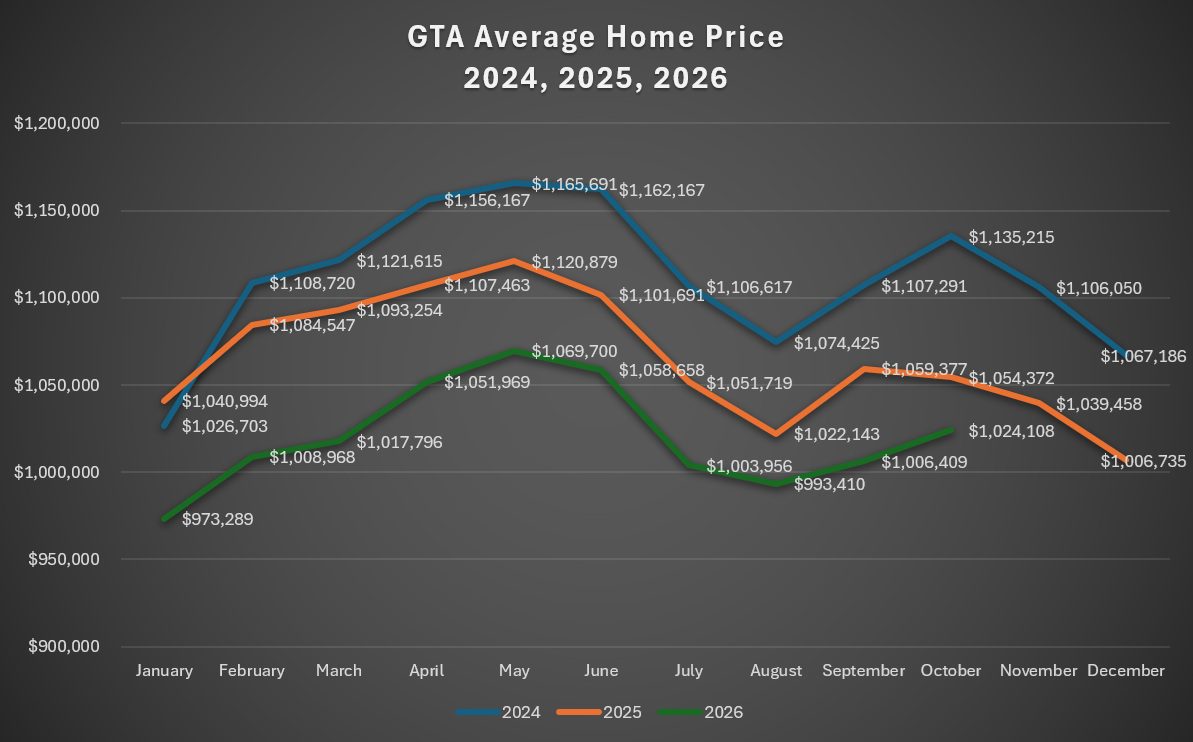
However, I would again point out the gap between 2025 and 2026, specifically in October.
For those asking, “Are we there yet?” in terms of finding a market bottom, it’s possible that this is where we’re headed.
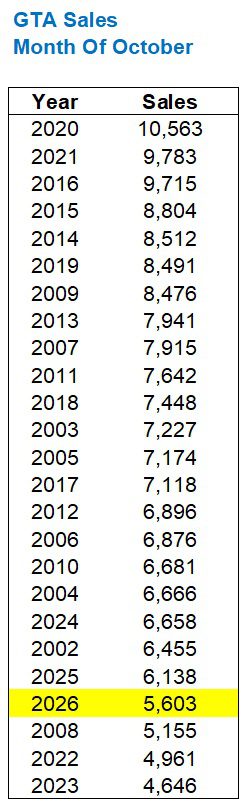
Sales increased from September to October by 11.2%.
However, sales were down on a year-over-year basis by 8.7%.
The charts will explain…
Alright.
October sales were down 8.7% from last year, which will speak volumes about how 2026 is going to finish up, but more on that in a moment.
In the context of our “post-peak” market, sales last month were higher than 2022 and 2023, but lower than 2024 and 2025.
This is what I honestly “felt” out there in the market last month.
Now, how do sales typically perform in the fall?
Like this:
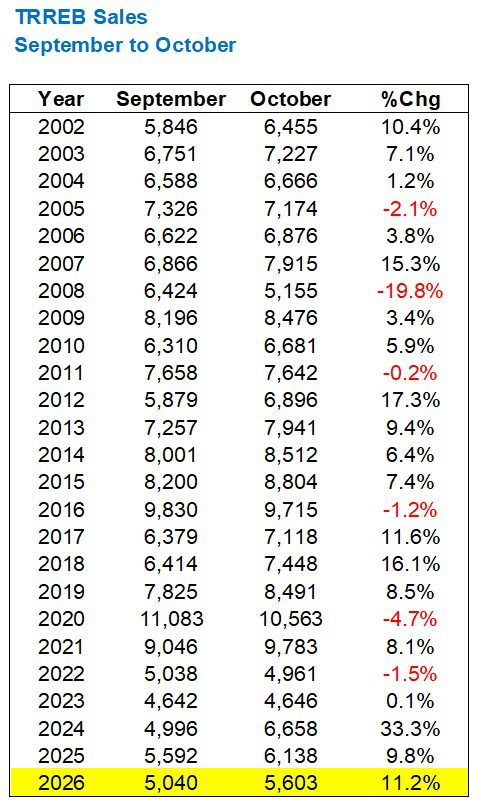
Eighteen out of the previous twenty-four years saw an increase in sales from September to October.
The average movement in sales from September to October during those years was +6.1%, so last month’s increase of 11.2% is significantly more than the trend.
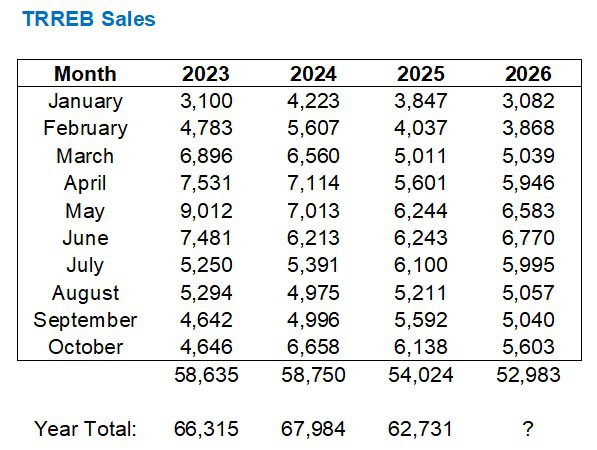
However, as I have been explaining in this space throughout 2026, we’re still on pace to see the lowest number of sales this millennium:
That’s right!
Those 62,731 sales from 2025 were the fewest since I began tracking this data in 2002, and we’d have to go back to the mid-1990’s, when our city was half the size, to find a year with fewer sales.
And yet, here we are in 2026, about to set a new record.
“Are we there yet?”
Have we hit bottom for properties sold?
This chart shows us just how much the trend changed in the second half of 2026:
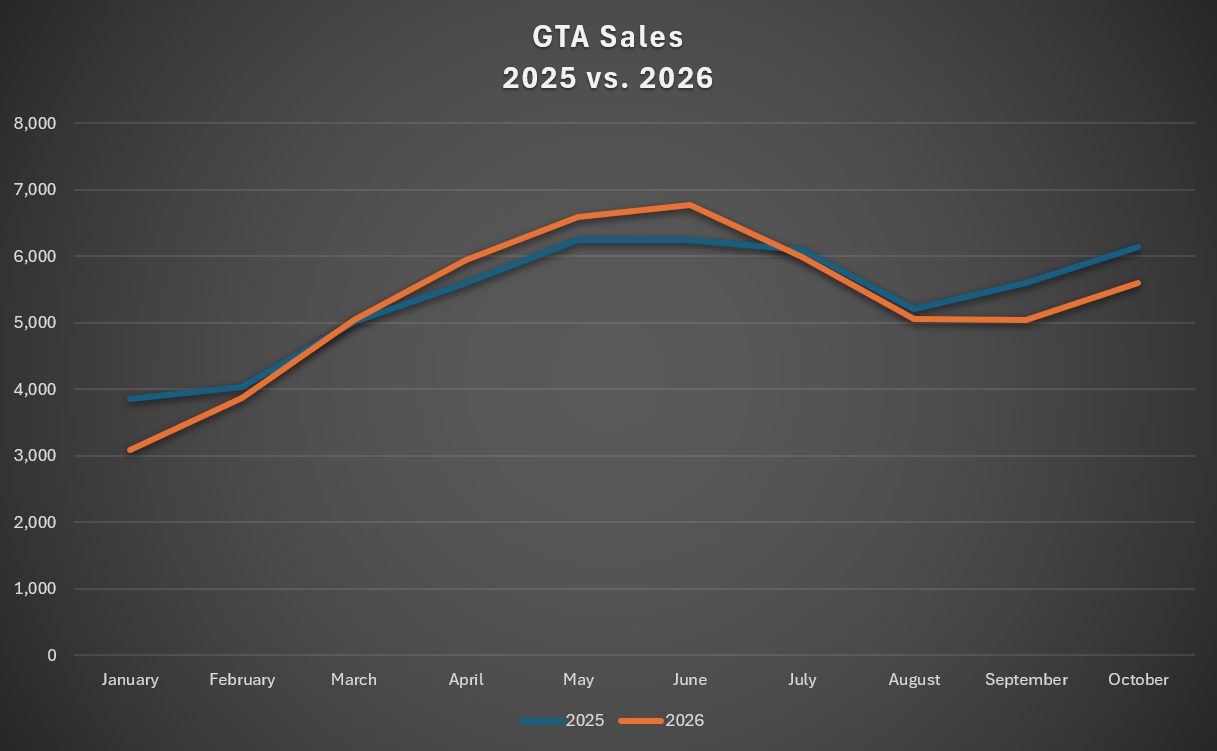
Inventory was down significantly in October, as new listings were down 14.1% from September.
New listings were also down from 205, as well as 2024, and even 2023:
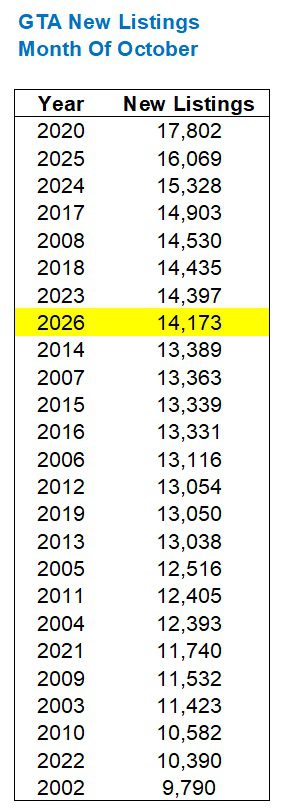
Rather surprisingly, this resulted in an increase in the market absorption rate.
With sales down, but inventory down at a higher rate, we saw not only a massive surge in month-over-month absorption, but also year-over-year:
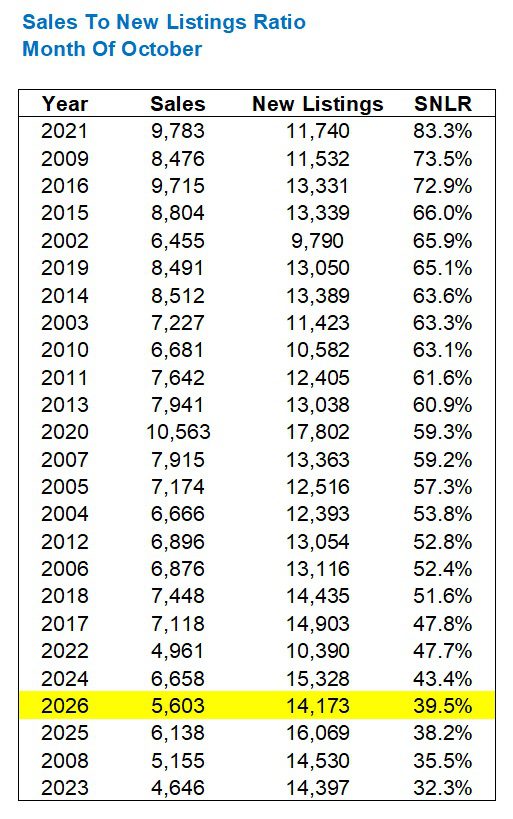
SNLR was up slightly from last year; 39.5% over 38.2%.
But our next chart shows how much the market tightened in October versus September:
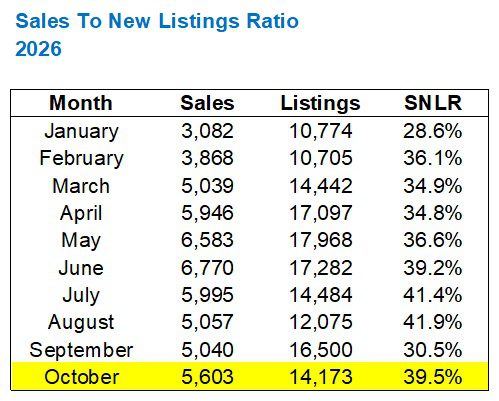
Or maybe September was just an outlier?
It seems that way, when we consider that October is in line with June, July, and August.
Perhaps there were just too many people with the same idea last month: spend the summer getting ready to list in September!
Now, back to price, just for a moment!
I mentioned that the TRREB average home price was up by 1.8% from September to October.
But where was it up?
Not in the 905, that’s for sure!
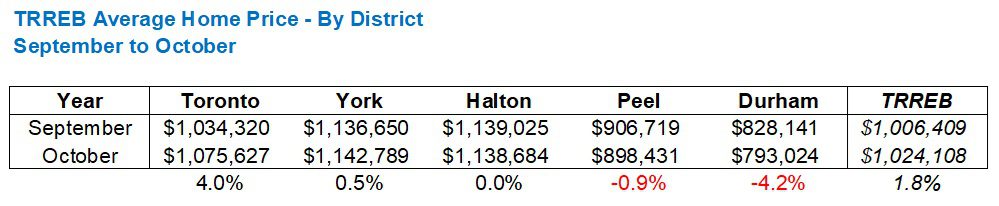
The 416 leads the way, perhaps not surprisingly, with a month-over-month increase of 4.0%.
York and Halton are flat, Peel is trending down, and Durham was hammered.
All told, this makes up our 1.8% average.
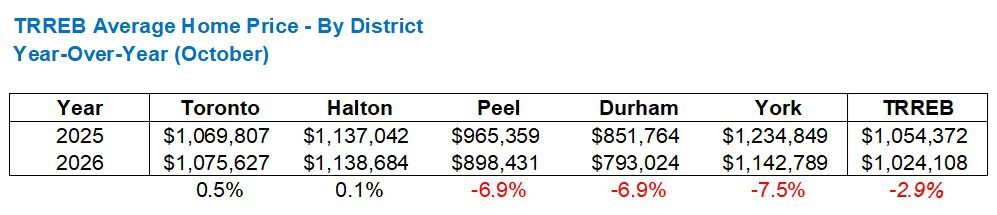
Lastly, if we’re curious about how the year-over-year decline of 2.9% breaks down by location, this chart speaks volumes:
As Bill said to Ted, “Whoa!”
A year-over-year decline of 2.9% can be further broken down to show just how different our sub-markets look.
Peel, Durham, and York have been hit hard in 2026, whereas we saw a modest uptick in Toronto and Halton. Call it flat or call it a rounding error, but there’s enough volume in Toronto to dull the pain of those 6.9%, 6.9%, and 7.5% declines in Peel, Durham, & York so that we arrive at a GTA average of only 2.9%.
That’s fascinating.
And while it’s only one month, I think it provides us with a very good understanding of how the 416 has performed versus the 905 in the last year.
Well, folks, I have to ask:
Are we there yet?
That depends.
Are you a buyer or a seller?
Are you in the 416 or the 905?
Do you own a house or a condo?
Are you upsizing your family with eyes to the future, or are you downsizing your home to focus on today?
Or are you simply a market onlooker with absolutely no stake in the trajectory of the market?
Regardless, one thing is for certain: we won’t know where we’ve actually gone until we get there.
Man, that’s some real fortune cookie stuff…