
Let me set the scene…
You’re an active buyer in the fall market.
After a very busy summer, filled with social engagements, relaxation, and “live in the present” moments, you’ve decided that you and your partner are going to buy a home this fall.
You know exactly what you want.
You’ve completed your mortgage pre-approval.
And right after Labour Day, your search begins!
Call it fate or call it beginner’s luck, but on September 15th, the real estate market presents you with a fantastic option.
It’s seemingly perfect.
Detached, four bedrooms, four bathrooms – including the master ensuite bathroom and the main floor powder room, private driveway, detached garage, and the backyard is spectacular.
You see the home with your real estate agent the day after the listing hits the market, and you think, “This could be it.”
You and your partner head back to the open house on the weekend, and it reaffirms that this house “checks all the boxes.”
Offers for this house are on the following Tuesday.
You’re a House Sigma junkie. You’re still watching every new listing that hits the market, and while nothing as good as this listing has come up, it’s starting to get your mind wandering…
After all, this house is fantastic. But is it perfect?
Not only that, the fall market has just started! So you start to wonder:
“Why would I jump at the first option?”
You and your partner decide to “pass” on the house, and on the offer night, the home receives four offers and sells for almost exactly what your real estate agent told you it would.
You continue to monitor House Sigma, but nothing else hits the market.
Every Friday, your real estate agent sends you some sort of email saying, “Hope you had a great week! No new listings of interest over the last few days, but we’ll cross our fingers for next week!”
The calendar turns to October, and the leaves begin to fall.
By mid-month, your agent sends you a new listing that you’re really excited about! It’s like the last house – detached, 4-bedroom, private driveway, decent backyard, only 3-bathrooms, but you can make that work. It’s a different style, slightly different location, and further from the Subway, but you really like the kitchen here. This could work!
You head over to the house for a look, brimming with eagerness and anticipation.
Walking through the house, you keep expecting to feel goosebumps, but nothing really “wows” you.
You’re just not getting the vibe.
It’s great on paper, but in person, it just doesn’t excite you.
Your partner says, “This isn’t as good as the one we passed on last month,” and while you don’t want to admit it, you know it’s true.
This house is a pass as well, and it promptly sells on the offer night. No love lost there.
Soon, the calendar turns to November, the Halloween decorations are gone, and the leaves on the tree aren’t much further behind.
Then we experience the first snowfall of the year, and we all act like we forgot how to drive. Our car dealerships are inundated with phone calls, and lamenting why nobody ever gets their winter tires put on before the first snowfall. History has a way of repeating itself.
By mid-November, without another solid housing option, you really start to worry that you’re not going to find anything in this fall market.
And while you are presented with another detached, 4-bedroom, 4-bathroom home in your target neighbourhood toward the end of the month, the house just needs way too much work. With the holidays coming up, you can’t commit to preparing for a small renovation, physically, mentally, or financially.
When we turn the calendar to December, you’re still holding out hope that a late-season home seller lists your dream property on MLS, but you know in your heart of hearts that it’s unlikely.
December is an exciting month, with social engagements, work parties, holiday extravaganza, and eventually – rest and relaxation. But it doesn’t change the fact that you weren’t able to purchase a home in the fall market, and now you’re looking at restarting the search in January.
Time flies.
Especially in the fall market.
Believe it or not, this story is a common one. The fall market is very short, and it’s not uncommon to sail through September, October, and November in the blink of an eye.
It’s also not uncommon, rather unfortunately, to pass on the first property, only to find that nothing as good comes along thereafter.
Any experienced real estate agent will have experienced this with a client or two, some more. And I would hazard a guess that it’s in the process of happening this fall with many buyers out there.
September was a tough month. I won’t lie.
Some of our listings sold while others didn’t.
But one common theme I noticed when speaking to buyer agents and asking why their clients weren’t interested in our listing was that many of them had the same classic line:
“It’s still early in my buyers’ search.”
When I pressed them a little bit, I was often told:
“This is the first great house they’ve seen this fall, and they’re just not ready to jump in.”
Exactly.
Buyers often don’t know why they’re not acting on a seemingly perfect house, but a lot of them simply want to see “what else comes out.”
It’s not quite FOMO, but rather they’re so accustomed to checking House Sigma or Realtor.ca for new listings that they almost seem to forget why they’re doing so in the first place.
In August, I asked whether or not it would be possible to see the TRREB average home price increase on a year-over-year basis in September for the first time since January of 2025.
The answer was an empathic “no,” as you’ll see in a moment.
And if you want to add “hell, no” in the comments section below, I won’t blame you…
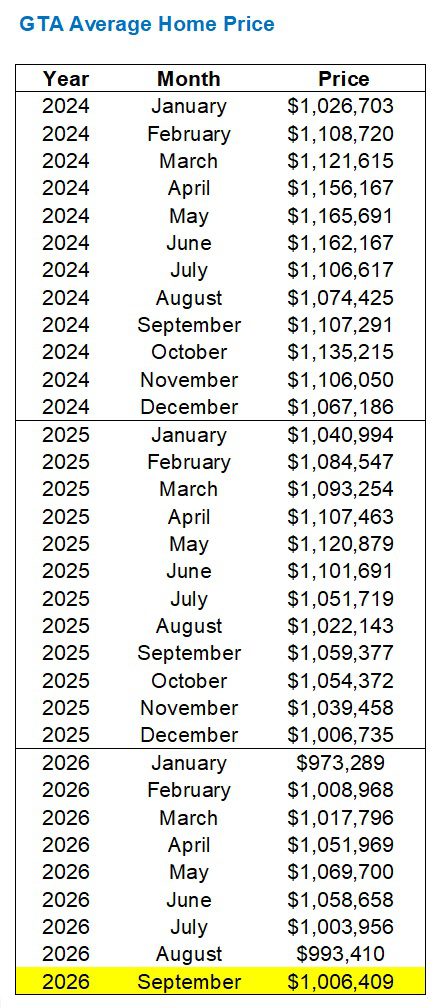
The average home price increased from August to September by a mere 1.3%.
That’s an increase, sure. But does it actually say something positive about the fall market?
I would suggest, “No.”
Not quite a “Hell, no,” but close.
Here’s how the average home price has moved from August to September since 2002:
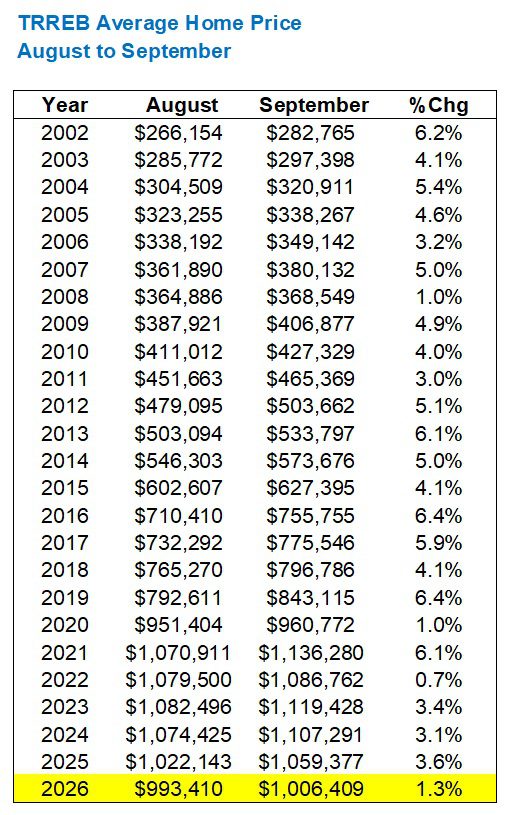
After seeing August-to-September increases of 3.4%, 3.1%, and 3.6% over the last three years, suffice it to say that last month’s modest 1.3% increase was unexpected.
It’s “bucking the trend,” if you will.
It’s a “bearish indicator,” if you want.
From 2002 to 2025, the average monthly increase was 4.3%.
As you can see above, we have never witnessed a September average home price that’s lower than August, but 1.3% is a serious drop from what we might have expected.
Had we followed suit with the last three years, that $1,006,409 average home price in September would be more like $1,026,888.
And for the record, to have seen the September 2026 average home price come in higher than September of 2025, that would have required a 6.6% increase from August to September. As you can see, the highest increase on the chart above is 6.4%, so really, truly, I don’t know what the heck I was thinking last month.
Now, why was I thinking that we might see a year-over-year increase in the month of September?
Well, because of our year-over-year chart!
The gap was shrinking, remember?
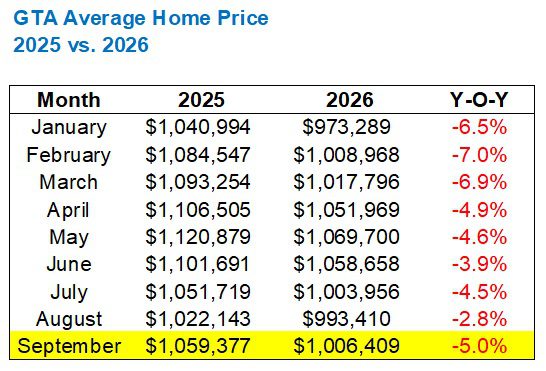
In August, the year-over-year gap had shrunk to a mere 2.8%, and the trend was going down.
This certainly turned around last month:
See what I mean?
From the winter through August, the year-over-year gap was shrinking.
Alas, it widened again in September.
You can see the last three years in the chart:
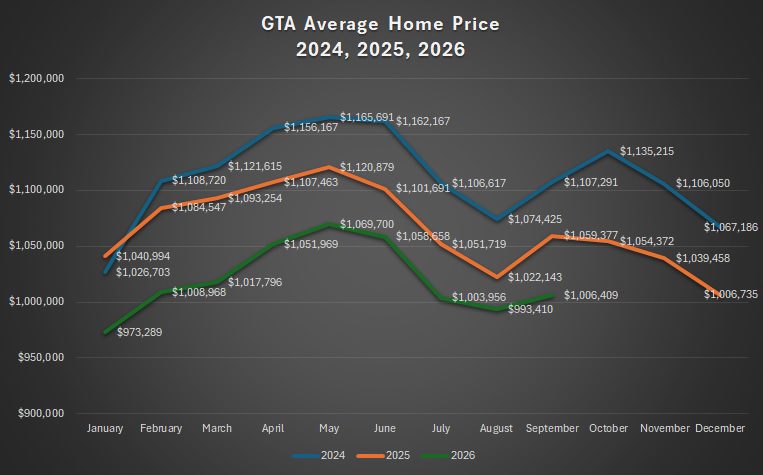
This chart just screams “declining market.”
There’s no other way to describe it.
While the gaps might widen and narrow here and there, there’s no question that the average home price metrics all remain in decline since 2022.
As for home sales, this is where things get even more interesting.
We saw only 5,040 sales in September, which ranks the fourth-fewest since 2002:
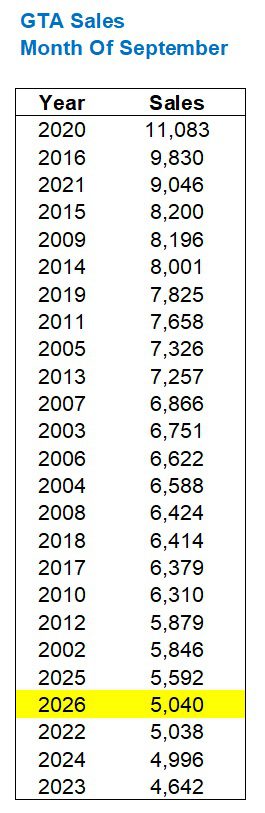
Ahead of 2022, 2023, and 2024, but behind 2025 by 9.9%.
But more interesting is that we saw 5,057 sales in August and only 5,040 in September.
Sales declined from August to September.
That’s wild! Not unheard of, as the following chart shows:
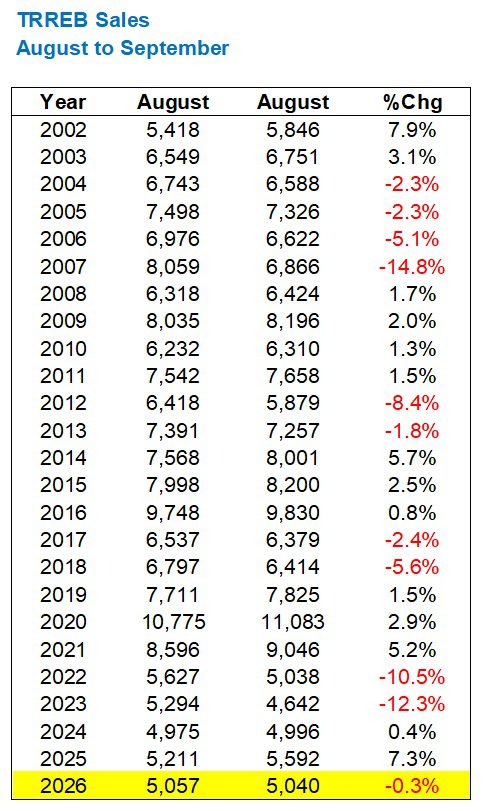
Ten times in the previous twenty-four years, we’ve seen sales decline from August to September.
Who would have thought? How can that be?
Well, not trying to make excuses here, but Labour Day can fall as early as September 1st and as late as September 7th. When it falls later, as it did in 2026, the month of September is much shorter from a real estate perspective.
Again, tell me that’s a reach, but who’s actively buying a house on the last long weekend of the summer in Toronto? And what seller is listing their home four days before the whole city packs up and leaves?
Now, how does this weak month of sales affect our yearly projections?
Suddenly it looks like we could see another all-time low:
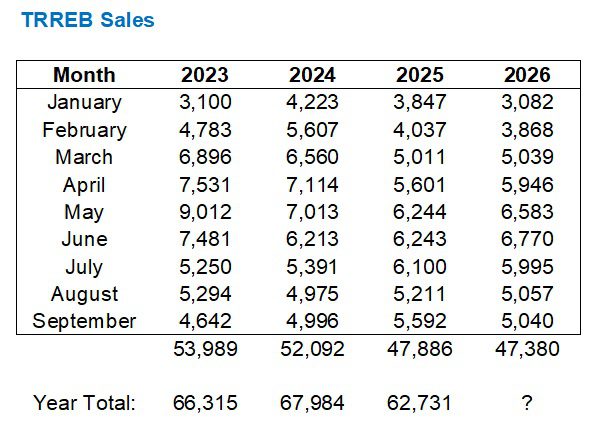
July, August, and September all saw lower year-over-year home sales.
Combine that with January and February, and we’ve now seen 5/9 months in 2026 show weaker home sales than in 2025.
You can see how this year-over-year sales contest looks on the chart:
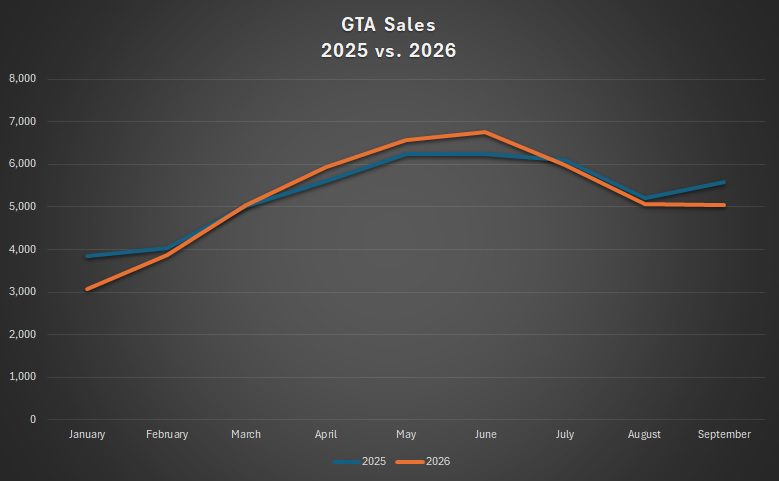
Bookends.
January and September both saw noticeable differences, with 2025 sales running higher, as did the prime spring market in April, May, and June.
While new listings were 14.3% lower in September than they were in 2025, they’re still nearing all-time high levels:
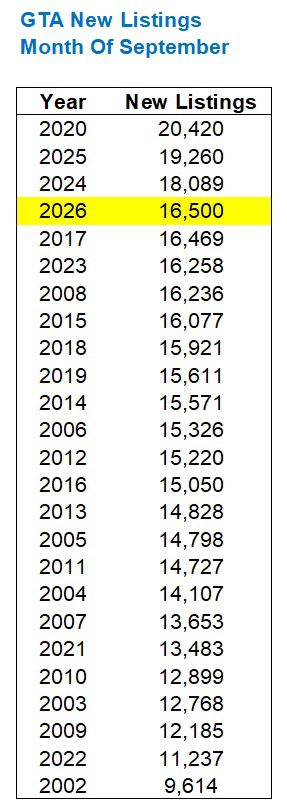
New listings were up 36.6% from August to September.
That metric was 32.2%, 44.2%, and 37.2% in 2023, 2024, and 2025 respectively, so last month’s movement in inventory levels was expected.
Of course, weak sales and a high number of listings means our absorption rate or sales-to-new-listings ratio is going to plummet.
5,040 sales and 16,500 new listings give us an SNLR of 30.5%.
Oddly, that’s higher than in 2025, but not by much:
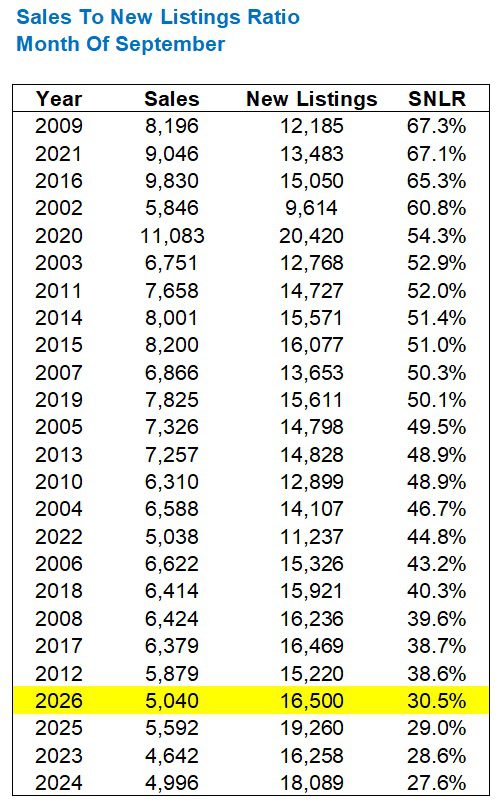
And only fourth from the bottom!
As for the SNLR trend in 2026, it’s moved completely in the other direction:
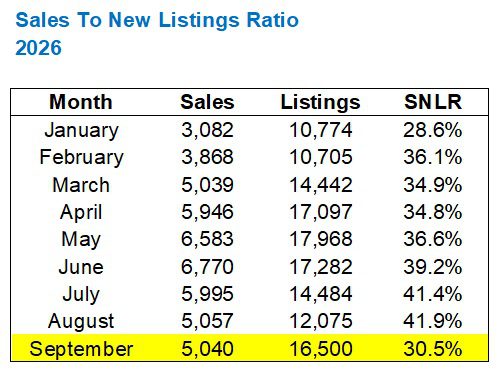
For what it’s worth, the SNLR is always lower in September than in the summer, and we always see this sort of decline.
But it moved from 37.1% to 29.0% in 2025, which is a decline of 8.1%. Last month, it dropped 11.4%. Just saying…
Lastly, we’ll return to home prices and see how that 1.3% August-to-September increase breaks down by region:
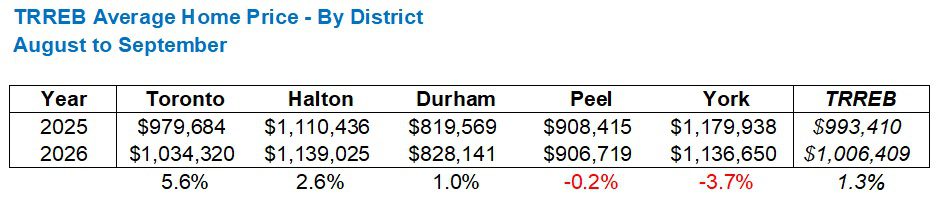
Make what you want of this, as it’s only one month, but I would always expect the 416 to lead the pack, whether the market is up, down, or sideways.
And if we want to further break down that 5.6%, month-over-month increase in average 416 home price by property type, it would look like this:
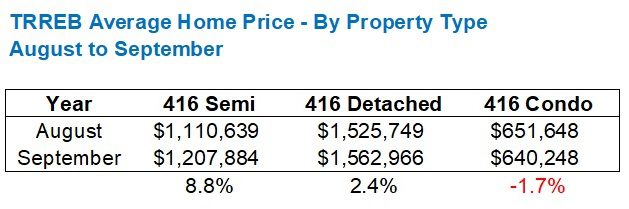
That’s exactly what I expected.
At least I got something right last month…