

Clients of mine got a heckuva deal on a house in late August.
Late August?
Who’s buying in late August, you might ask?
Well, perhaps the better question is: who’s selling in late August…
While I understand that sometimes, it pays not to be like everybody else, and that a contrarian strategy can often be successful, listing your home in the final two weeks of August makes no sense to me. If that truly was the “strategy” here, then I think it was a poor one.
You’ve heard me say this before, time and time again:
The last two weeks of August are the slowest time of the real estate calendar, save for the December holidays.
While it would be an exaggeration to say, “Everybody’s on vacation,” it’s fair to suggest that many people are on vacation, or away for the weekends, or extremely busy with activities in the last two weeks of August, so much so that it makes our real estate market a virtual ghost town.
My office was empty in those two weeks.
I emailed maybe a handful of properties to my buyer-clients, at best.
And yet in the middle of all this comes a spectacular new listing for one set of my buyer-clients, right in their target area, and I will admit, well-priced too!
We saw the property on the second day of the listing, then again one week later.
By the time we went to make an offer, it had been listed for twelve days.
Twelve days is not an eternity, by any stretch. But by the time our offer was submitted, we were only one week from the start of the busy fall real estate market, and that’s when, as I explained to the listing agent, a deluge of inventory would be competing against her listing.
I was negotiating, of course.
Truth be told: if this house was listed in the third week of September when all the market participants were back, and when buyers were fully immersed in their searches, I think it would have sold in an instant.
But alas, it was listed in the last two weeks of August, and it didn’t sell.
So by the time we offered $120,000 below list price and said, “This is our absolute best price,” the listing agent started to wonder whether I was right and whether carrying this listing into a post-Labour Day market was a good idea.
Evidently, she and the seller decided that it was not. They accepted our offer, which was so far below my perceived market value, that I would put it on my list of “best deals of 2026.”
But that was then, and this is now. This is the fall market. Summer is over!
The fall market has always excited me, but not necessarily because of what it is, but rather because of what it isn’t.
Consider that the two most common dates for buyers to begin their real search are at the start of January, with a new year upon them, and then at the start of fall, after the rest and relaxation of summer.
For buyers starting their search in January, there’s a ton of runway. They can begin slowly, take their time, ramp up in spring, and they essentially have six months to act before the market slows down for summer.
For buyers starting their search in September, the game is entirely different. These buyers keep one eye on the market and the other eye on the calendar, knowing that if they want to be in their new home for Christmas, they’d better pull the trigger in September or October.
Even if they don’t need to be in by the holidays, they surely recognize that the runway is short! If they don’t purchase by the end of November, they’re out of options. Their search draws to a close as they begin to realize that not only do they have to sit through the slow month of December, watching time tick by without any quality listings to peruse, but also that they’re now looking at buying in January or February, at best, and perhaps not being moved into their new home until mid-Spring!
The fall market isn’t the spring market; it’s not long. It’s not drawn out. There is no seemingly endless runway, and for that reason, the market is often fast-paced, energetic, dynamic, and challenging!
So let’s look back at the August TRREB stats and see if they can act as a sign as to where the market is headed.
We’ll start with an updated look at the average home price.
In this space last month, I wrote:
Now, an important question:
Will we see the average home price dip below $1 Million in August?
I will predict…………yes.
Maybe it wasn’t that hard a prediction to make, but it doesn’t make me any less correct in the process…
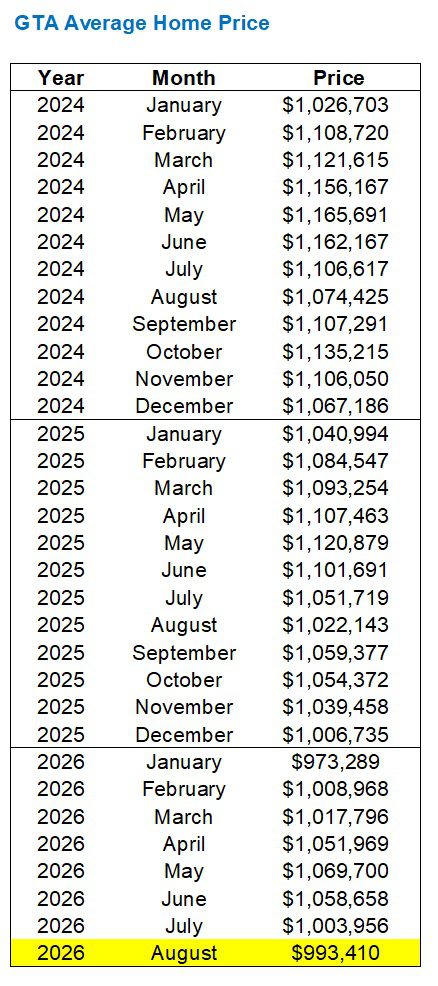
The average home price declined from $1,003,956 in July to $993,410 in August, which is a 1.1% decline.
Now, you might suggest that “average home price must decline every year from July to August, but not quite.”
There have been five years out of the past twenty-four when we saw an increase from July to August.
And if we were to try to shape last month’s activity as bullish, I would draw your attention to the July-to-August movement over the past several years:
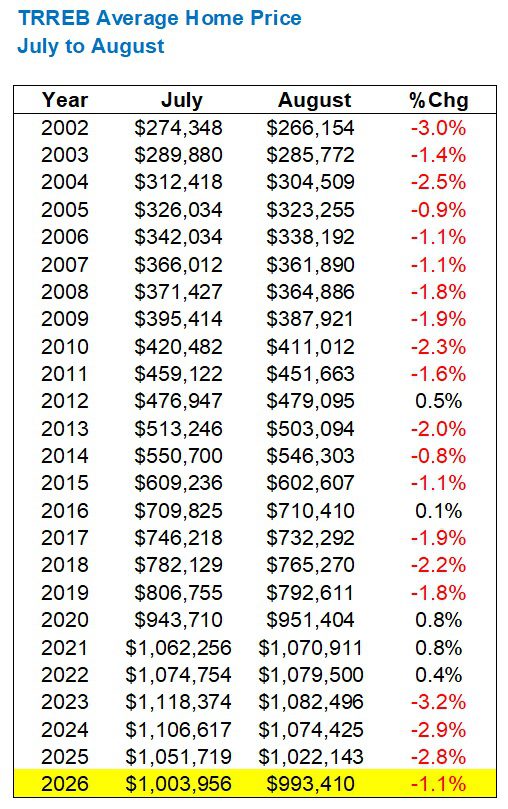
In 2023, 2024, and 2025, we saw the average home price decline by 3.2%, 2.9%, and 2.8%, respectively, from July to August.
Seeing that average home price only decline by 1.1% last month is certainly a bullish indicator.
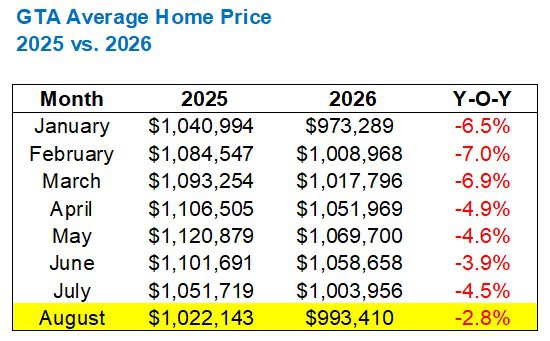
More to the point, I’ve been showing year-over-year monthly trends throughout 2026.
Our year-over-year gap peaked in February, when the average home price was down by a whopping 7.0%.
Since then, the gap has shrunk significantly:
I asked in this space last month whether or not the summer market was “a sign of things to come.”
If you look at our chart below, you can see how the gap widens in February and tightens in August:
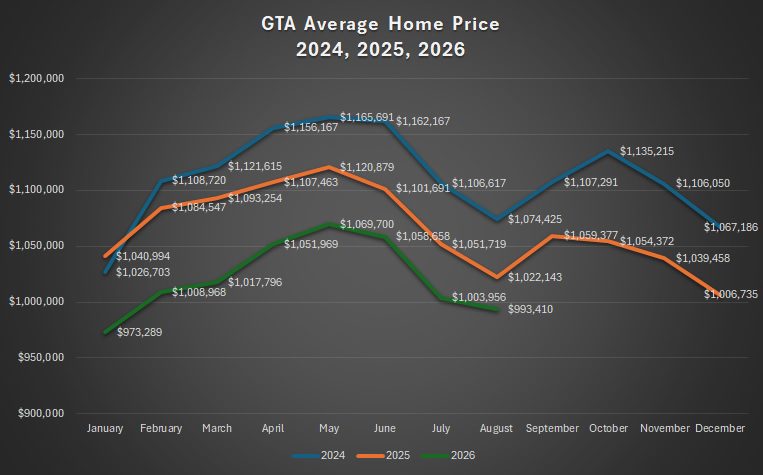
Call me crazy, but there’s a non-zero chance that we could see an increase in the year-over-year average home price in September.
In September of 2025, the average home price was $1,059,377. That’s barely ahead of this past June.
It’s doable.
Let’s keep an eye on that.
Alright, now that I’ve been bullish, allow me to be bearish.
Sales were down from July, but they were also down from August of 2025:
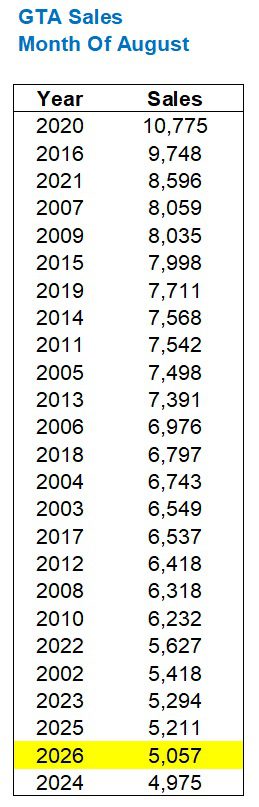
I say this every month, but look at the bottom four numbers on the list. It’s the last four years!
If not for 2002, the last five years would all be at the bottom.
I mentioned that sales were down from July, which is to be expected, but the month-over-month decline was the largest since 2015:
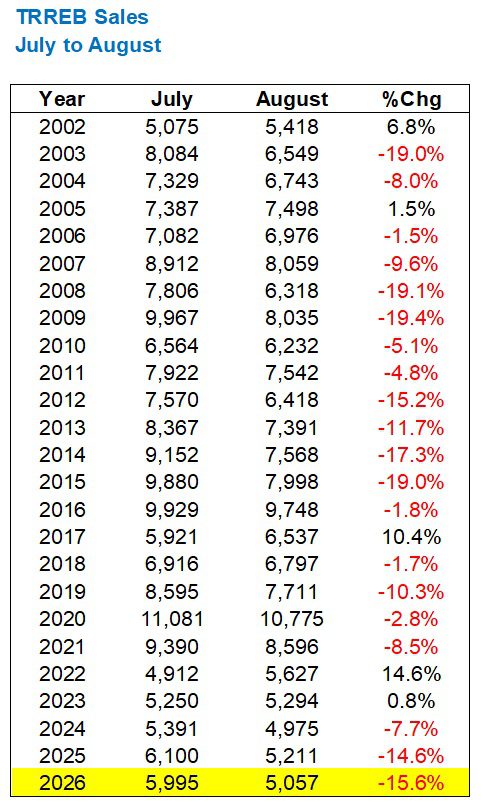
Weaker sales in August is going to narrow the overall gap between 2025’s sales and those of 2026, right?
We saw higher 2026 sales in March, April, May, and June, before they slipped behind 2025 in July, and now again in August.
Through eight months, 2026’s sales data is barely ahead of 2025:
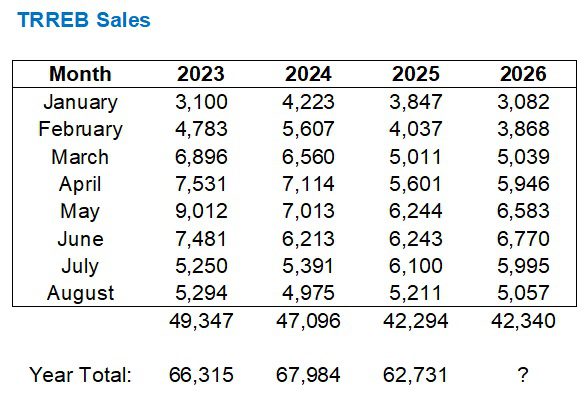
A reminder: 2025 saw the fewest sales in Toronto since the 1990’s, which, adjusted for population, is essentially “the lowest sales ever.”
For what it’s worth, inventory was middling:
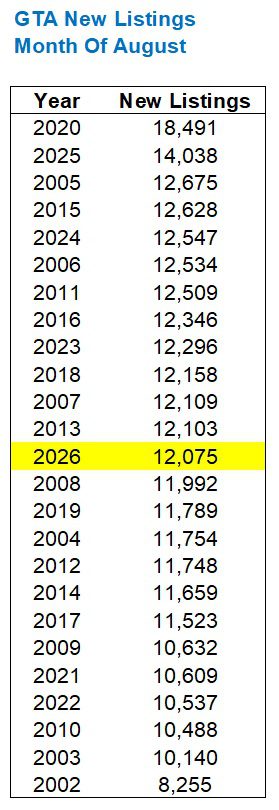
That’s nothing spectacular.
But in the context of the market absorption rate, it tells us what we need to know in relation to sales:
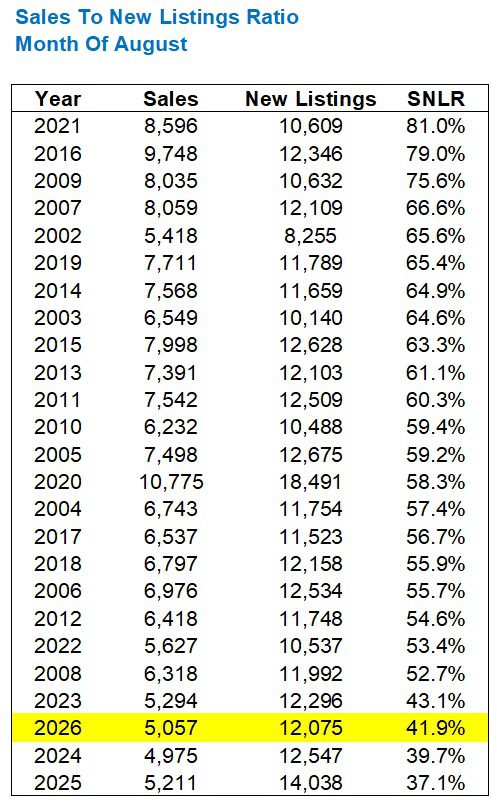
Again, the absorption rate in August is the lowest over the last four years as it’s ever been.
Last month was ahead of 2025 and 2024, but still a ways from that 50% threshold that separates a “buyer’s market” from a “seller’s market.”
If we look at the SNLR through 2026, it sure does resemble this thing called a “trend,” doesn’t it?
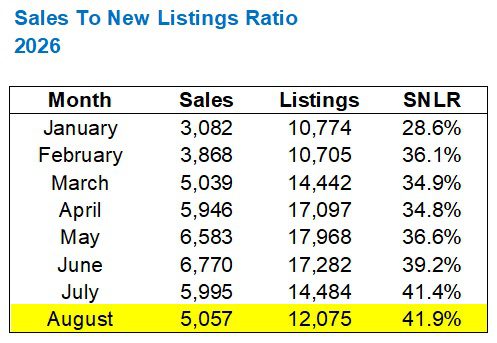
We might think that the trend should continue, and a 43% figure in September could lead to a 46% figure in October, and so on. But I personally think this number is going to plateau.
Last, but not least, I want to go back to prices for just a moment.
We mentioned that the August average home price is down by 2.8% from 2026.
Where is it down, and by how much?
Let’s look at property types in the 416:
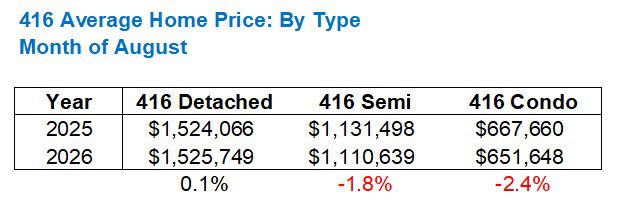
This tracks. And I wonder how it will look in September!
Mental note: come back to this in a month.
Now, as for the 905, the data is strikingly similar:
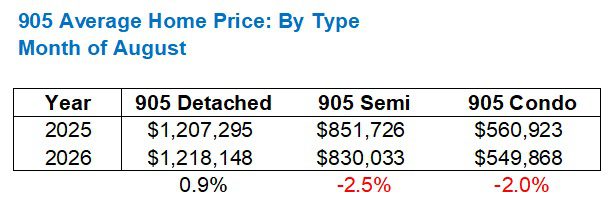
Detached houses are holding in; semi-detached and condos are falling.
Understood.
So what say ye?
Can we use any of the summer data to predict what’s going to happen in the fall?
Data or not, I’m all ears for your predictions, bullish or bearish.
Speaking of which, what happened to TRB reader and comment section stalwart, OSCAR LUTGARDIS?




























Serge
at 9:36 am
Looking at the sales of last four years, one wonders, if the old terms “spring market” and “fall market” still make sense? Is not there rather “summer market”?
Lizard
at 3:02 pm
I want to hear more about the house that was purchased for 120000 under asking…