
We’re about to find out!
After Monday’s blog, where I think a lot of people were shocked to see the Calgary Home Price Index (HPI) price is only up 4% in the last ten years, I figured perhaps it would be educational to look at a few other selected Canadian cities, and compare their appreciation rates against the Canadian average.
Calgary, Toronto, Montreal, Vancouver, Guelph, Ottawa, Moncton, Regina, Saskatoon, and Victoria will be our focus today, and I’ll provide you with the HPI prices for each month over the last decade…

Folks, let’s have some fun.
I know many of you are already rolling your eyes, but I promise – this will be fun, if you have the time, and the desire.
There are ten cities on our list:
Calgary
Guelph
Ottawa
Moncton
Montreal
Regina
Saskatoon
Toronto
Vancouver
Victoria
Here’s the fun part: put these in order of appreciation over the last decade.
It’s simple.
Before you start scrolling through this post, write down the ten cities, and put them in order.
Then grade yourself afterwards, and see how you did.
If I had the time, and the know-how, I’d develop a cool app on here that allows you to do it automatically, and then records your score, and shows you how you fared against others.
But yeah, the whole time thing. And know-how…
I’m hoping at least a few of you will take me up on the challenge, and record your results below.
For the record, I got #1 and #2, and that was it.
I’m going to show you a chart of the monthly HPI Benchmark Index, for ten years, starting in November of 2007 and running to November of 2017. In Monday’s blog, I the month of November because I was comparing real estate values to the stock market, which had taken a huge hit in 2018. So to keep consistent with that theme, and because December is a poor representation of the real estate market, and January’s numbers are not yet complete, we’ll look back one decade from this past November.
And we’ll use a red line over the chart to indicate the Canada-wide HPI.
For those who don’t know what HPI is, you can read about it HERE.
Ready?
–
#10: Calgary
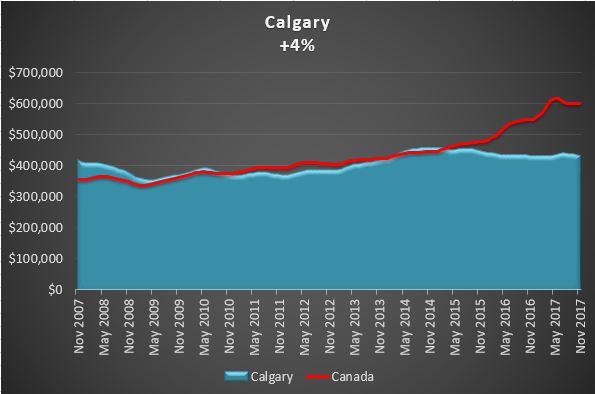
Absolutely shocking!
4% in ten years. Wow.
I was so shocked at this number when I presented you with it in Monday’s blog, that it became the impetus for today’s blog.
Many people point to Calgary and Edmonton as two of the most industry-dependant cities in the country, and I can’t argue. If the oil isn’t flowing, then the jobs aren’t to be found. And that’s a bad recipe for real estate prices.
The Calgary HPI dropped by 15.1% from November of 2007 to April of 2009, which was the decade’s low-point.
The high-point of $455,200 was reached in January of 2015 – an increase of 9.7% from our November 2007 start-date, but as you can see from the chart, prices have dropped – to a current (November 2017) price of $430,700, hence the modest 4%, decade-long gain.
–
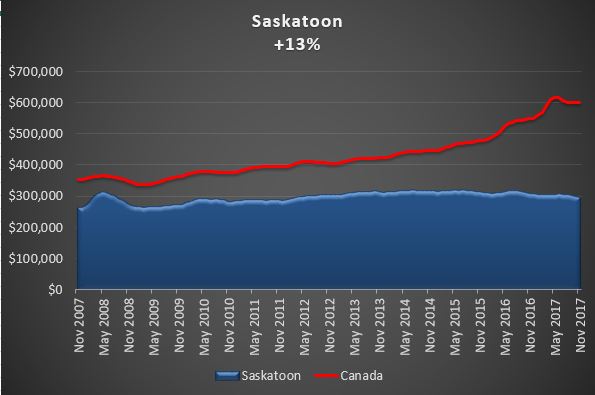
#9: Saskatoon:
I’ve been to 32 of the 50 United States, but I’ve never been to Alberta, Saskatchewan, Manitoba, or anything outside Quebec.
So I don’t even know how to evaluate the price of real estate in Saskatoon.
As you can see from the chart, there was a huge spike in 2008, when the HPI rose 19.5% inside of 6 months. Ironically, after that spike, Saskatoon became the least volatile of all the cities we’re profiling.
Incredibly, the HPI remained between $300,000 and $320,000 for 64 straight months, from June of 2012 to September of 2017.
The peak HPI was of $319,600, reached twice – July of 2014, and May of 2015, representing a 22% increase from the start of our timeline.
–
#8: Moncton
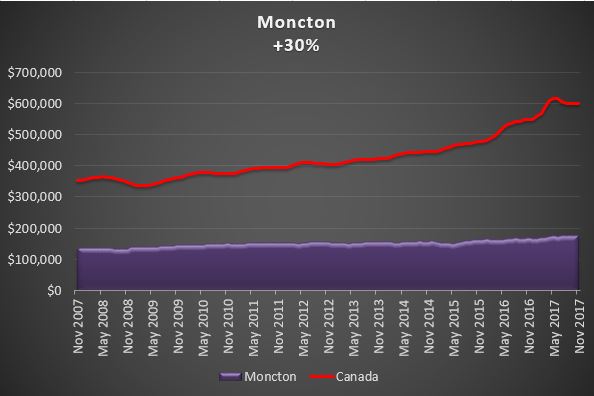
Moncton is probably the most boring of our ten graphs, because it really doesn’t do anything interesting.
Saskatoon was flat for a while, but at least it had a spike!
The peak of Moncton’s HPI was reached in August of 2017, but at $175,600, compared to $175,000 in November, it’s basically at its peak, for all intents and purposes.
This is one of the most slow, gradual inclines you’ll see in the country.
–
#7: Victoria
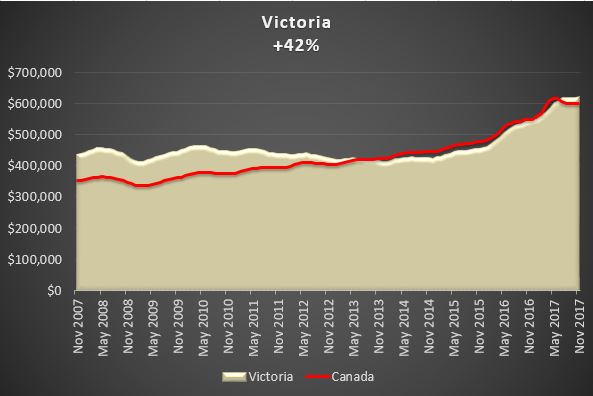
Here begins the start of four cities that have virtually the same increase over the last ten years, although they all got there in very different ways.
Who would have thought, in November of 2007, with an HPI of $437,300 over six years later, in March of 2015, that number would actually be lower.
Yes, it dropped to $436,100. 6 1/2 years later, and prices were down.
Of course, since March of 2015, prices are up 42.6%. Not bad for less than 3 years!
It’s also worth noting that the Victoria HPI started 2007 well above the Canada-wide HPI; $437,300 compared to $354,300, but dropped lower for over four years, before finally climbing back up in July of 2017.
–
#6: Montreal
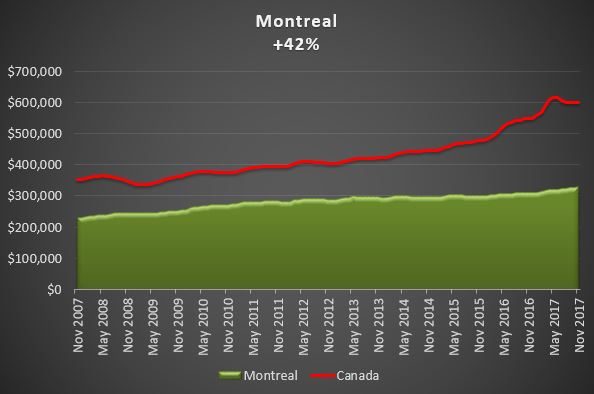
Montreal represents another pretty boring chart.
Nothing really doing here, folks!
Anecdotally, I had heard the Montreal market had dropped significantly through a friend that lived in the downtown core, circa 2008. But perhaps it’s charts like these that show us how stories can differ from stats. Oh, yes, we’re quite familiar with that concept here in Toronto…
Montreal, along with three other cities out of our ten, currently sits at its HPI high, at $330,500, up 42% since November of 2007 as the chart shows.
–
#5: Regina
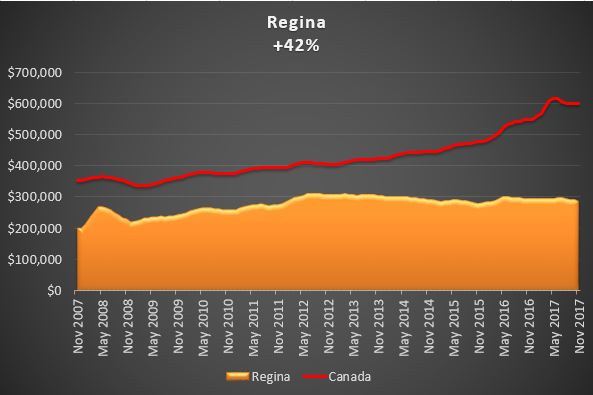
This chart reminds me a lot of Saskatoon, no?
Saskatoon saw a 19.5% spike inside of 6 months.
Regina saw a whopping 33.9% spike in the same time period.
What was going on in Saskatchewan back then, folks? I honestly can’t remember, but I do remember the story itself.
The peak HPI came in June of 2016 at $299,900, a 50% increase from the start of our time period, as prices have declined modestly since then to an HPI of $284,100.
–
#4: Ottawa
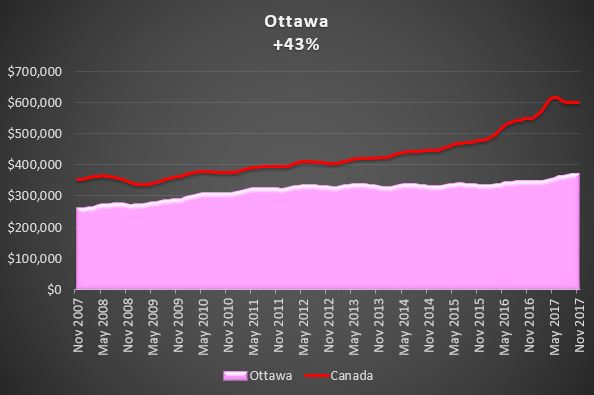
Ottawa is yet another city with an extremely long period of flat growth.
For a period of 49 months, April 2012 to March 2016, the HPI stayed between $325,000 – $340,000.
That’s a 4.4% band, inside of over four years.
Like Montreal, Victoria, and as you’ll see shortly – Vancouver, Ottawa’s November number represents its 10-year-high, and the last year has been kind to Ottawa, with a 6.7% increase.
–
#3: Guelph

I know what you’re thinking: “Guleph, huh?”
Some of you went to school there and never wanted to go back.
Others, have never been.
Still others, say the name “Guelph” five times in a row, and think it’s the oddest sound they’ve ever heard.
But other than the University of Guelph, the city should be known for something important: jobs. The unemployment rate in Guelph has always ranked among the lowest in the country, and according to the last census in 2016, was exactly that – 3.9%, the lowest in the country!
It’s also only 1H 5M from Toronto, and is commutable to some people. My barber lives in Guelph, and he sleeps two nights per week at his in-laws’ in Toronto, and the rest in Guelph.
The peak HPI price in Guelph wasn’t reached too long ago – June of 2017, at $421,800 –
–
#2: Vancouver
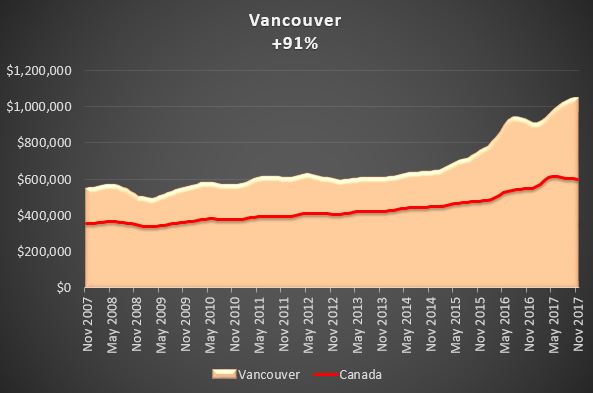
Be honest – did you have this at #1 or #2?
I had Toronto at #1, but it’s totally reasonable if you had Vancouver and Toronto interchanged.
While the HPI in Vancouver is still 40% higher than in Toronto, the appreciation in the last decade still trails.
Vancouver’s HPI actually dropped 10% from November of 2007 to March of 2009, but it’s been rolling ever since.
We know that prices dropped in 2016-17 after the “foreign buyer’s tax” was introduced, but prices have since recovered, going from an HPI of $941,000 in August of 2016, down to $905,800 in January of 2017, and now back up to $1,046,900, which is the decade-long high.
–
#1: Toronto
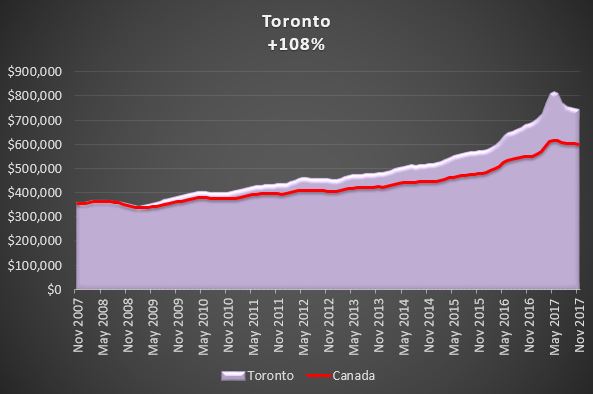
Can you believe there was a time when the Toronto HPI was the same as the entire country?
It didn’t last long, but back in 2007, the numbers were tight.
November of 2007 – The Canada HPI was $354,300, and the Toronto HPI was $358,700.
The two numbers stayed tight through the end of 2008, and then began to diverge.
Like Vancouver, Toronto also saw a dip in the HPI from the start of our timeline, going from $358,700 in November of 2007 down to $343,800 in February of 2009, a modest 4.2% dip, compared to 10% in the same time period in Vancouver.
Also like Vancouver, Toronto saw a drop in the HPI after the foreign buyer’s tax was announced, and this is where things get interesting: do you want to predict our market follows what happened next in Vancouver? Or do you want to predict that we don’t get back to the May, 2017 high-point any time soon?
The $816,400 peak last May represented a whopping 128% increase in the HPI since November of 2007, although it’s since dipped to $744,700, and thus the 108% increase you see above.
Any way you look at it, a 100%+ increase in a decade is impressive.
–
So now, I welcome the results of your predictions, for those of you that played the game.
And for the record, my order was the following:
10) Calgary (I knew this coming in, obviously)
9) Moncton
8) Regina
7) Saskatoon
6) Guelph
5) Ottawa
4) Montreal
3) Victoria
2) Vancouver
1) Toronto


Barf Turder
at 8:49 am
The realtor invented HPI is nothing more than Franken Numbers created by shysters in order to fool the public.
Signed ~ ‘Wrong For Another Decade’
Andrew
at 11:02 am
Spoken like a true renter.
“Wrong for another decade” makes you sound like Donald Trump. Look at the numbers, Toronto is up 108% in a decade and David was a market bull, how is he wrong??
Professional Shanker
at 11:17 am
I conducted some analysis on HPI (past 6 years) because I had my suspicions as well given that it’s inputs are adjusted which makes it ripe for manipulation – that said it did follow the average home price albeit I noticed a somewhat lagging nature during periods of volatility. The lag is likely due to mix.
Appraiser
at 9:17 am
Excellent data and information today David. Well done.
Speaking of Indexes: Teranet Index out today – “Toronto index stopped trending down in January…first rise in six months.”
“The Toronto index rose 0.2%, the Vancouver index 1.2%, the Victoria index 1.0% and the Montreal index edged up 0.1%. All the other component indexes were down on the month: Hamilton (−0.2%), Ottawa-Gatineau (‑0.2%), Edmonton (−0.3%), Calgary (−0.3%), Halifax (-1.0%), Winnipeg (−1.1%) and Quebec City (−2.0%). For Montreal, it was a 13th monthly increase, and for Hamilton it was a fifth decrease in a row.”
https://housepriceindex.ca/#maps=c11
For those that are unaware, the Teranet Index tracks closed transactions and is therefore considered by many to be an accurate but somewhat lagging indicator of the real estate market.
Dan
at 9:58 am
Better than I thought I’d do
Toronto
Vancouver
Guelph
Ottawa
Montreal
Saskatoon
Moncton
Regina
Victoria
Calgary
Kramer
at 10:33 am
Great data and charts. Very interesting especially since as we all say Real Estate is (or should be) a long term game.
There was a big convo in the past on why a city like Guelph was crushing a city like Ottawa in home price appreciation.
These long term charts put it a bit more in perspective.
Would it be enough to say that:
Guelph real estate market is a derivative of the Toronto real estate market.
Ottawa real estate market is a derivative of Government jobs market.
Just as:
Victoria real estate market is a derivative of the Vancouver real estate market
Calgary real estate market is a derivative of Oil jobs market.
Ralph Cramdown
at 10:34 am
Sell Toronto, buy Calgary?
It’s the Brad Lamb trade, though obviously with better timing.
Condodweller
at 12:32 pm
I wouldn’t necessarily sell my PR but a paid off investment condo in Toronto would probably buy 10 condos in Calgary. Note to self, get RE license and sell TO condo and buy 10 in Calgary at multi-year lows and wait for the Feds to sort out getting our pipelines built so we can get stopped being screwed by our friends to the south and wait for prices to recover in Calgary.
Professional Shanker
at 12:00 pm
Something to note – A significant amount of capital in terms of renovations went into the Toronto market to achieve the +100% return over the past decade – that said still a tremendous increase in price albeit during a environment of reducing to stagnant interest rates. If someone would have gone variable through the entire period – they would have reaped the greatest benefit!
David’s prices are nominal in nature (not adjusted for CPI) and the cumulative CPI increase in the period 2007 to 2017 was roughly 17%, majority of cities still look great after adjusting for real returns but Calgary is -13%, storing your money in a low interest bank account would have yielded better results there!!!
lui
at 12:19 pm
David it’s still a bit early but have you noticed condo sales strength and pricing been very strong .I been following the condo sales and sold prices for units north of Dundas , west of Yonge,south of St Clair and they been selling in less than a week at or above asking.2018 looks to be a banner year for condos again.
Condodweller
at 12:21 pm
Good way to spend 5 minutes. I thought Vancouver would have beat TO but I guess our recent runup put us ahead. I’m surprised to see Ottawa ahead of Guelph as I would have put Guelph as a Toronto proxy but not ahead of Vancouver/Victoria
Vancouver
Toronto
Victoria
Montreal
Guelph
Ottawa
Calgary
Regina
Saskatoon
Moncton
FreeMoney
at 3:36 pm
I actually did surprisingly well (and I attribute virtually all my “success” to having been a regular reader of David’s blog for about three or fours years now) although I did put Vancouver #1 and Toronto #2. I had Guelph and Ottawa #4 and #5 respectively when in actuality they were #3 and #4. My two primary errors were overrating Victoria (#3 vs. actual #7) and underrating Regina (#9 vs. actual #5). Lots of fun and great reading.
Jimbo
at 8:00 pm
Vancouver
Toronto
Guelph
Ottawa
Victoria
Montreal
Regina
Saskatoon
Moncton
Calgary
David
at 11:06 am
Have anyone noticed that almost all of the big gains occurred starting 2015 where the curve got progressively sharper and sharper. What changed so much in 3 years?
Sardonic Lizard
at 11:25 am
> What changed so much in 3 years?
Seriously? Are you that oblivious to what’s been going on in the housing market here in Canada?
Tommy
at 6:45 am
Tell us what changed in 2015 to cause escalating prices?
Tommy
at 10:59 pm
Chinese money flooding global urban real estate markets?