

I had the wrong day!
All geared up for offers on a beautiful east-side listing on Tuesday night, and it turns out that offers are on Wednesday night.
Mea culpa.
Now I have an extra two hours on my hands, so what do I do? Take a nap on my office couch? Call a family member to catch up?
Nah.
Open Microsoft Excel and start entering data…
I currently have nine condo listings scheduled to hit the market in September, and I’ve told all the sellers that the market is somewhat mixed. We professionally stage all of our listings, after working with the seller to de-clutter (I always tell people to expect that 50-75% of everything they own will be moved out), paint, deep-clean, and use the best photographer in the city. So whether the market conditions are good, fair, or poor, we expect to out-perform the market.
Where will things end up in September? That’s what I can’t say for certain. But having those honest conversations with sellers, ie. that your condo might have sold for $670,000 in late-February but could sell for $640,000 in the fall, is crucial right now.
In order to understand where things may go, I find it’s always prudent to look at where they currently are, and where they’ve been.
While we’re not quite through the end of August yet, and since it takes a week for TRREB to release the sales data, I just don’t feel like waiting another two weeks to put my pulse on the market. So today, I sat down and started to put numbers into a spreadsheet and look at where the market is.
I did something similar last month, after a full month, but with the market changing daily, I figured now was the time I wanted to answer these questions. Looking at the first three weeks of August, and not the whole month, is a bit odd. But it’s a “snapshot.” Like how we were taught in high school accounting that a “Balance Sheet” is a snapshot of the finances, and can be done at any time.
As we speak, many sellers are preparing to list in the fall. Knowing how the market is going to finish the month is tantamount to any sales strategy.
First, let’s look downtown and see how the inventory levels through the first three weeks of August compared to the same period in July:
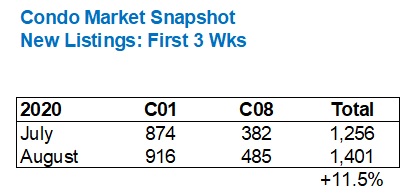
First of all, this is a huge relief for me!
I often refer to the art versus the science in our business, and that means a gut feeling on price could often be more accurate than what comarpable sales statistics might tell you. IN this case, my “feeling” is that downtown condo listings are way, way up this month! So seeing only an 11.5% increase is pleasing.
However, the trend, historically, is for listings to go down from July to August, not up.
Here’s last year:
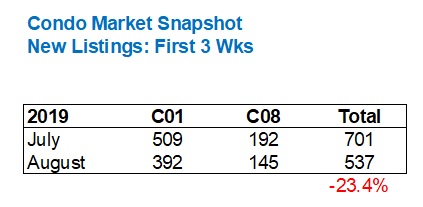
That’s a 34.4% turn-around, if we want to look at it that way.
But based on the timing of this year, with the pandemic wiping out solid months of spring market, I think listings going up when they usually go down isn’t as bad as one could make it out to be.
Moving away from C01 and C08, since I’ve often been told I have a downtown bias, let’s look at all the major TRREB areas and see how new condo listings have compared in the past three weeks, compared to last year:
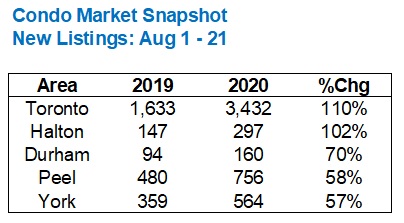
Now here is where the numbers start to line up with what I’m “feeling” out there.
Condo listings in Toronto have increased by a whopping 110% in the first three weeks of August this year, compared to the same period last year.
And if you’re playing along at home, you can whittle this down C01 & C08 by using the respective figures above – 1,401 in 2020 and 537 in 2019, and see that new listings are up a whopping 161% over last year.
Ironically, it’s downtown that’s leading the charge in terms of the massive increase in new listings. Because if Toronto as a whole is up 110%, but downtown is up 161%, you can see how big of an impact downtown is having compared to the rest of the 416.
Halton Region is in the same boat as Toronto, however, with listings up 102% over last year. While it’s a much smaller area, with fewer than 10% as many listings as Toronto, the increase is still valid.
Durham, Peel, and York are all up significantly, as you can see.
And again, I want to reiterate that much of this inventory is due to the pandemic. But how much is a completely different story. If we’re used to seeing a decline in new listings from July to August, then perhaps some of the increase in year-over-year new listings in August can be explained by the pandemic? Again, how much is some?
A 110% increase in new listings, year-over-year, is tough to explain no matter what.
So how do we make sense of this?
Should we look at the corresponding sales data?
Yes, but first I think it would be prudent to look at the corresponding freehold data, just to see if it’s condo listings that have skyrocketed, or all listings.
Here’s the same figure as above for freehold:
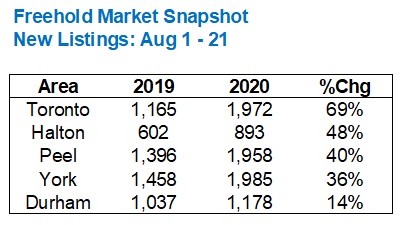
Interesting.
Freehold listings are up 69%, year-over-year. But condo listings are up 110%.
I think that reaffirms, no matter how you want to look at this, that the increase in condo inventory isn’t just becasue of the pandemic. If it were, then listings would have increased at, or around, the same rate as that of freehold.
The dichotomy of inventory increases in these areas is interesting as well.
Subtract the increase in condo inventory from the increase in freehold inventory in these two areas, and it looks like this:
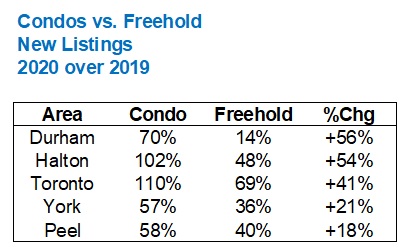
That’s wild!
New condo listings are up 70% in Durham but new freehold listings are up only 14%? I find this chart to be very interesting.
Perhaps some of this could be explained by condo completions, but it could also be explained by speculation in the condo market, or simply a case of fewer home-owners in Durham region deciding to move.
So now let’s move to sales, and see how the condo market looks in August of 2020 vs August of 2019:
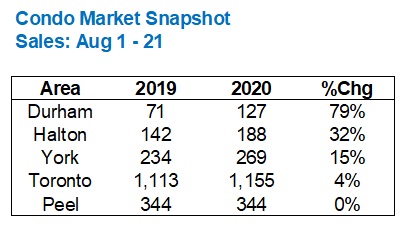
I honestly don’t know how to make sense of this.
A spread of 79% down to 0% seems almost random.
Again, I’m somewhat 416-focused, so my eye goes directly to the 4% figure for Toronto.
Is that 4% figure good?
I mean, condo sales are up, year-over-year, right?
Nothing rhetorical or facetious here, folks. The fact that condo sales in Toronto are up, during a time when many of us would say that the condo market “isn’t so hot,” is a good thing.
But what about C01 and C08 specifically?
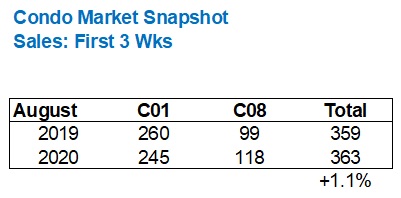
It’s a wash.
359 in 2019 and 363 in 2010. A 1.1% increase, basically a rounding error.
So while sales are up 4% in the 416, they’re only up 1.1% in the downtown core.
Now how does the freehold market compare in terms of sales, to the condo market?
Let’s take a look:
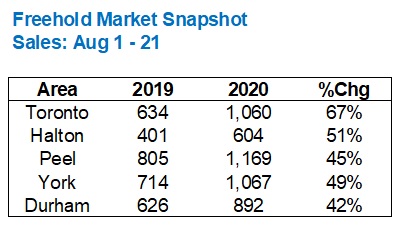
Wow!
Okay, so, where to start…
Condo sales in the 416 are up a mere 4%, year-over-year, for the period we’re looking at, and yet freehold sales are up 67%?
While I think it’s just as fair to call the freehold market “hot” as it is to call the condo market “cold,” I simply can’t gloss over the disparity here.
All areas are up, year-over-year.
And only one area saw a higher increase in condo sales than freehold sales, which was Durham (79% increase in condo sales and a 42% increase in freehold sales).
I’m not surprised at all to see the Toronto (416) is leading the way in terms of increased freehold sales, but it really, really makes me come back to that modest 4% increase in condo sales, and conclude that, yes, the condo market really has changed, post-pandemic shutdown.
So last but not least, and this is where we tie it all together, how does the Sales-to-New-Listings ratio look?
It’s one thing to say, “Condo sales are only up 4% in the downtown core, year-over-year, but it’s okay, since they’re still up regardless,” but it’s another thing entirely to say that when listings have skyrocketed.
As a result, the SNLR, year-over-year, has plummeted:

For the first three weeks of August, the SNLR for Toronto (416) has dropped from 68.2% in 2019 down to 33.7% in 2020.
That 33.7% SNLR is the lowest of the five major TRREB areas, and it’s not even close.
The difference of 34.5% is also the lowest of the major five areas, as you can see.
For comparative purposes, I give you the same for freehold:
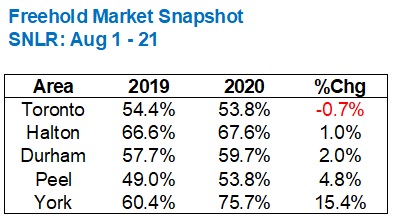
Interesting that the SNLR for condos has declined, I will say. But listings for freehold are up substantially and proportionately higher than sales.
Nevertheless, call the 0.7% a wash, and we see that the decline in SNLR for condos, through the first three weeks in August, is concerning.
Too many listings.
Sales are up, moderately, but not enough.
What does that mean for prices?
And how does the rental market factor into this?
A topic for Friday, I believe…


Ed
at 8:35 am
C01, C08 listings up 161% sales up 1.1%= Buyers market
Appraiser
at 9:22 am
Buyers’ market implies lower prices. That is not the case.
Correction: Increase in inventory = a better supplied market, with annual price escalation blunted to less than 10%.
Pragma
at 9:56 am
So do you still think condos are going to bounce back? I keep beating that drum but I’ll say it again – the Toronto condo market is in trouble. The “tight market” was artificial, there were many “investors” sitting on empty units happy to watch that equity pile up. There were many airbnb units which make sense when the economy is hot, but not when we’re in a recession and even less so when we’re in a socially distanced pandemic lock down world. We went from people competing for rentals to rental listings sitting at 6300 units in the downtown core, and growing by the day. How long before these investors capitulate? And what’s coming just over that horizon that’s going to improve things? Mortgage deferrals are ending. Condo completions over the next year at the highest number ever. WFH for another year at least. Every dynamic that was being used to justify the incredible valuations are all in reverse. Job growth, immigration, supply shortage,… “investors” forgot there is risk component to investing in real estate and were pricing condos as risk free investments. Prices need to adjust so that you get an appropriate risk-adjusted return. negative yield, 0%, 1%, 2% are not appropriate returns for a condo investment and anyone who bought a condo at those levels is learning that. The market will correct sharply and it never stops at fair value. A 30% correction would get us back to long term trends…
Appraiser
at 3:25 pm
Bears never capitulate.
Chris
at 4:00 pm
https://www.bloomberg.com/news/articles/2020-08-21/bears-are-going-extinct-in-stock-market-s-13-trillion-rebound
Have you capitulated?
Nick
at 10:09 pm
This is good for buyers, they can hopefully be able to make offers with conditions and no bid wars. It’s an opportunity for inventory to catch up to demand. Next year when restaurants and tourism are back to normal people will want to be in the city again.
Appraiser
at 5:50 am
What was your prediction again?
Chris
at 8:41 am
Was this part of your bull trap prediction?
https://www.cnbc.com/2020/08/26/stock-market-today-live.html
J G
at 4:28 pm
Serious question Appraiser, do you own any of these stocks? If you do, you should be happy. If you don’t, well you should 🙂
AMZN, AAPL, FB, GOOGL, MSFT, NFLX, TSLA
Smart money sold the investment condo earlier this year and backed-up the truck on FAANGs.
jeanmarc
at 6:01 pm
Add NVDA to the mix. Majority at their ATH’s. I am sure a few more will announce splits and they will shoot to the moon 🙂
Bal
at 6:42 pm
I think just like real estate …..stock market is insane right now….I never knew pandemic means all the assets will be on fire…lollol
Appraiser
at 6:59 am
@ J G: Hot tip – Sells stocks buy condo. Continue arbitrage until wealthy.
You amateur stock humpers really kill me. Fretting over the equity markets daily. One month’s data – let alone a quarterly report guides decision-making.
And let’s not forget that 30% scalping on the Dow Jones, shall we.
Lots of blood on the streets back then – eh?
No vision.
J G
at 9:53 am
@Appraiser, one month data?
I’m pretty sure I made posts where I showed FAANGs have outperformed Toronto RE over the last 15 years. I’m a stock humper? You’re a RE humper.
How’s the August data looking for the condos? https://housesigma.com/web/en/market?municipality=10343&community=all&house_type=C.&ign=
Fearless Freep
at 6:10 pm
And we’re supposed to believe you only bought (in March or April) stocks that have been “on fire” since then? Okay, fine, you’re the Canuck Warren Buffett. We all acknowledge your genius. Will you shut up now?
Libertarian
at 10:11 am
David, you wrote this post at the beginning of June
https://torontorealtyblog.com/blog/where-has-all-the-inventory-gone/
Seems your client was a couple of months early in talking about a boat load of listings, but he was right after all.
Jimbo
at 11:32 am
I’m not sure we can quantify how society feels about living in enclosed spaces in large cities after COVID. Not yet anyways.
Some factors to consider:
1. How many people fled rentals to live with parents to limit exposure and ended leases. Causing more people to consider selling their condo rather than deal with lower rents or competing for new clients;
2. Want to move up into house, semi, townhouse to escape enclosed spaces earlier than planned with the substantial gains made over the last 2-3 years;
3. willing to move to suburbs to get the above; and
4. Those that are going to make the jump and can make the extra $1k-$3k in payments for something that isn’t a condo or have the ability to live at parents until they size up that DP requirement.
At the end of the day those that bought condos over 12 months ago are probably smiling and are able to move if needed, those that haven’t should be fine after the dust settles they just need to wait for the dust to settle and the population to adjust and say it is okay to live in condo communities.
Derwanker
at 12:50 pm
Pretty much. I feel very cramped in a detached downtown, as I’m WFH, with kids, and want more space as I am basically here almost 24 x 7. Can’t imagine how it would be to be in a condo with no backyard and elevators to deal with in the current situation. Hellish, I’d lose my mind.
I think condo downtrend will continue for some time, and will put upward price pressure on freehold homes in the GTA for at least a year or two.
Jimbo
at 6:15 pm
Can’t under estimate the love for the chic factor and little to no maintenance. That may be overturned by anti germ culture.
Even in your case maybe you valued commute over yard and bigger house.
Bijan
at 12:27 am
WFH negates the commute advantage as long as it lasts of course. Even those commuting are now facing lighter traffic.
Karolina
at 12:08 pm
Curious to see how many condo listings September will bring. Usually it is a very busy time after a quiet August. With so many units already on the market and I suspect a flood of new ones coming in, it may be a great time to buy. These may be the best opportunities to get a fantastic unit without engaging in a bidding war! Refreshing…
I am excited. I own many rental properties and yes, some tenants have left and rent prices are dropping but I have been doing this for 15 years and this is a great opportunity!
John
at 9:28 pm
To add a bit more info for all of you, as of today, besides de SNLR David mentioned there are 2862 active condo listings in Toronto, which is the highest seen in the past 10 years for the condo market. The second highest corresponds to June 2016 with 2583 listings and, in the past 3 years, the highest was 1329. Inventory is piling up, sales are going down and in addition to that the rental market is so gloomy that many more units will start flooding even more the condo market shortly. If all of that, plus the mortgage payments deferral coming to an end, is not the perfect recipe for a big price correction, I don’t know what it might be. The musical chairs game is about to get the music stop.
Jimbo
at 12:17 am
What ever you do, don’t hold your breath. You need to be here in two years telling everyone how and why it didn’t workout that way.
Thomas
at 12:20 pm
Many who bought in 2017 wont make a profit if they sell now. Let us talk about this after another 10 years too. It will be interesting to see the rate of returns then.
Clifford
at 11:27 pm
Have read posts like this for the last 10+ years. Condo prices will come down a bit and then they’ll go right back up.
John
at 11:26 am
Guys,
It is neither about holding your breath nor believing real-state go right back up all the time. This is about fact checks, the price correction is happening already, see below my analysis on avg price per sqFt starting from the peak:
2020-02: Avg: 874 CAD
2020-03: Avg: 866 CAD
2020-04: Avg: 828 CAD
2020-05: Avg: 834 CAD
2020-06: Avg: 820 CAD
2020-07: Avg: 819 CAD
2020-08: Avg: 800 CAD
There is already a 9.25% price decline in development, we just need to see how low it can go, and from my previous post about inventory, things are looking very clear.
Looking at past data, during the last 10 years, we had a small correction of 4.64% in mid-2017 and 5.27% in the fall of 2018, in both cases number of active listings was below 1300 units and there was not an ongoing pandemic.
Now, look at these numbers about active listings per month:
2020-02: 664 units
2020-03: 974 units
2020-04: 1123 units
2020-05: 1338 units
2020-06: 1892 units
2020-07: 2347 units
2020-08: 2886 units
That is an increase of 4+ times from the beginning of the year.
Let’s keep this discussion active!
John P.
P.S. this is publicly available data.
John
at 3:30 pm
A few more facts:
The number of new listings has skyrocketed, the highest seen in the past 15+years was 1800.
See below the development since the beginning of the lockdown:
2020-04 746 new listings
2020-05 1164 new listings
2020-06 2069 new listings
2020-07 2449 new listings
2020-08 2400 new listings
Inventory is piling up of course due to low demand.
John P.