

Er, that should read 2017-2018, since technically, the sale I want to discuss has run through two calendar years.
There’s a difference between a seller and a listing agent working tirelessly to get a property sold, and that of two people who just have no clue what they’re doing, and fail to acknowledge market realities.
Let me explain how not to sell real estate in 2018, and then give you a dynamite look at a real, live mess of a listing – now in its second year…
Hmmmm…..an auspicious start to the blog.
Is that really the best image I could have come up with?
Some nights you feel creative, and some nights you use an image that looks like a sign on the side of a ski hill…
The month of May is in the books, and I for one am looking forward to seeing the TREB numbers when they come out today/tomorrow. I’m most interested in seeing the following five statistics:
1) Average GTA Sale Price
2) Average Toronto Sale Price
3) Average Toronto Condo Sale Price
4) Average Toronto Detached Sale Price
5) Total New Listings
The average GTA sale price is the holy grail of real estate statistics, and while many of us only care about what’s going on in the City of Toronto, and don’t want the statistic to be skewed by sales in Grey County, the overall number is still important as it puts the “big picture” into context.
The Toronto-specific average price is just as important, however. For those of you that live in Oakville, Richmond Hill, Unionville, et al, you would disagree. But as the overall GTA market has declined, I think many would have predicted that properties “close to the core” would come out ahead. So far, that’s the way things look. But I’m curious to see if April’s trend continued into May.
I also want to see how new listings compared to April, as well as to May of 2017, as I think they’ll be down once again.
June is always an interesting month.
On paper, it should be the second-best month of the year to sell, after May.
There are a lot of fair-weather buyers out there, as well as sellers who truly believe that a freehold, single-family home is best shown when trees are green, flowers are blooming, and kids are still in school.
In practice, however, June can often be hit or miss. Last June was a dreary month to sell. After the market turned in late-April, and continued through May, the month of June basically saw about 30-40% of home-sellers re-listing their homes for sale after failed “offer nights,” and often going through 2-3 listings at various prices.
I do not expect this June to be like that, however. I’m merely pointing out the stark contrast between this year and last.
I’m bringing out at least five listings this month, some of which were strategic in nature. I personally expect this to be a very strong month, and if you’re a seller out there, and you’re about to go to market – be confident!
Now of course, in order to be successful in this market, a seller can’t shoot him or herself in the foot, and expect to walk past the finish line.
Whether the market is up, down, or sideways, there are always sellers and listing agents that read the market wrong, implement incorrect strategies, give the buyer pool too little credit, and overestimate the value of their homes.
Remember last May/June, how many sellers were listing and re-listing, over and over? It was an epidemic. I even wrote as much on my blog:
May 19th, 2017: “Real Estate’s New Problem: Listing & Re-Listing”
Last year was a whole other level; like nothing we’ve ever seen.
But even still, we’re seeing the odd seller this year make the same mistakes. And I continuously bang my head against the wall, wondering how the seller could be so stupid to think the buyers our there, are that stupid.
Here’s my favourite example to date:
I’ve deleted the address, in case you haven’t noticed.
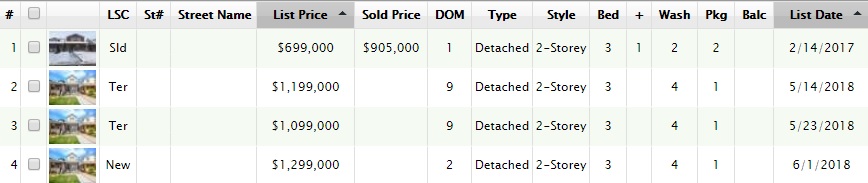
So this property was sold in 2017 for $905,000, renovated, and the seller tried to flip it.
You can see how the listings unfold here, but if you’re like me, you do a double-take when you see $1,199,000, then down to $1,099,000, then up to $1,299,000.
What happened?
This is the crazy part.
We know that sellers will often list a property, receive no offers, then re-list higher, right?
You list at $999,900 with an offer date, even though your property is worth somewhere between $1,150,000 and $1,225,000. But offer night comes, you don’t get what you want, and so you re-list higher at $1,224,990 the day after your failed offer night.
But what happened with this detached listing above is priceless.
The seller, who is also the agent, lists at $1,199,000 and sets an offer date for May 22nd:

Offer day comes and goes, but the seller/agent doesn’t get what he wants.
So what’s the move?
Re-list higher at $1,299,000, which is what he wanted to begin with?
Nope. Not yet, at least.
As you can see above, the seller/agent re-lists lower at $1,099,000, and sets a-n-o-t-h-e-r offer date!
Check it out:

That offer date fails too, so then the seller/agent re-lists at $1,299,000:

Outstanding!
What I find truly amazing is the thought process of the seller.
Let me try to get into his head for a moment; it goes something like this:
“Well, I set the price at $1,199,000, looking for $1.3M, or thereabouts. It didn’t work. The market didn’t respond. So what the heck went wrong? What did I do incorrectly? And more importantly, what can I do in order to correct my mistake? Well, maybe I didn’t set the price low enough! That’s it! So maybe I’ll just re-list even lower this time – $1,099,000, and assume that buyers won’t remember my listing from three days ago, and think that I actually want $1,099,000, then bid it up to $1.3M! That’s it! I just need to completely ignore the fact that you don’t get a second chance to make a first impression, and hold on to the naive belief that an inexperienced, unqualified, inside-the-box thinker like myself can outsmart and manipulate the market.”
Yes, something like this.
I just find this absolutely amazing.
How in the world can this seller/agent think that the market would respond to this “strategy?”
He could have waited 4-6 weeks, and maybe the market would have forgotten the property.
But to re-list the next day at a lower price, with a SECOND offer night? It’s so bizarre! It’s so illogical! And yet this was an idea from a real estate professional.
Now, my second-favourite listing this spring has to be this one, which is now on its seventh listing.
Take a look:
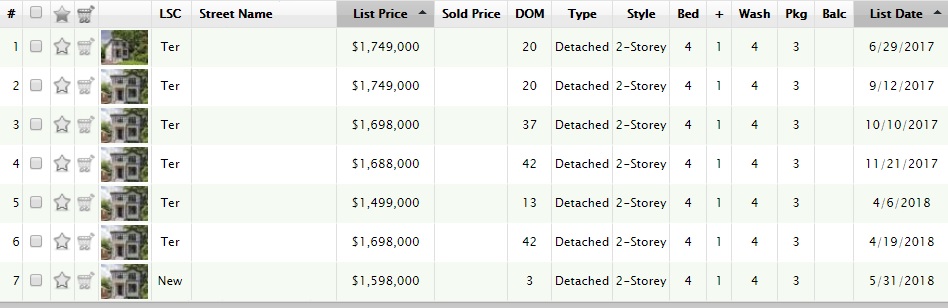
They tried the property on the market for $1,749,000 in June of 2017, and it didn’t sell. Twenty days on the market, and they took it off in July.
They re-listed in September, which makes sense, since September is a busier month than July or August. Although the detached home price was down in September from June, but that’s hindsight talking.
After 20 days at the same $1,749,000 price, they took the property off the market for about two weeks, and then re-listed at $1,698,000.
Still no takers.
Now here’s what you can’t see from the screenshot above, and pay very close attention.
On November 21st, they re-listed the property for $1,198,000.
Yes, you read that correctly.
$1,198,000, with, of course, an offer date.
That offer date didn’t work, so they increased the price to $1,688,000, which is what you see there – #4 on the list. MLS shows the last active price, and it’s only in the listing’s history that I can see the $1,198,000. Plus, I remember this listing.
So that was their first attempt at “under-listing” as a strategy, which they did to the tune of $500,000.
They left the property at $1,688,000 for another five weeks, before they terminated on January 2nd.
They took their time in early 2018, and with that time put in between the last failed listing, and the new 2018 spring market, they decided to try under-listing once more.
So there they went, listing #5 on the photo above, at $1,499,000, with an offer date.
This time, they held back offers for almost two weeks – 13 days!
Did it work?
No.
They terminated the listing, and re-listed for the 6th time – at $1,698,000.
42 more days on the market before, apparently, they started to feel the burn.
They listed for a 7th time, with a $100,000 price drop, and here we sit at $1,598,000.
Amazing, right?
In hindsight, many of you will point out that the cost of their debt is likely $10,000 per month, not to mention property taxes, utilities, and maintenance. So had they sold for $1,598,000 in June of 2017, they’d actually be $120,000 further ahead.
But hindsight is hindsight, so we won’t go there. Even though I just did.
My issue with this listing is more to do with the seller and listing agent’s lack of respect for the buyer pool, just like the seller/agent from the first example.
Buyers are not as stupid as sellers want them to be.
It’s like the seller at a department store saying, “That will be $20,” and the customer says, “That’s too much,” so the seller says, “How about four $5-bills then?”
There’s something to be said for “showing your hand,” and many sellers don’t acknowledge it.
If you list your property for $1,500,000, and nobody buys it, and then you re-list for $999,000, the buyer pool doesn’t think you’ll actually sell for $999,000. Nor would they probably think you’d sell for…..maybe…..$1,400,000. They know what you want, because you already showed your hand! And you can’t change that.
You can’t have a second shot at making a first impression.
This simply isn’t the way to sell real estate in 2018.
Er, try to sell real estate in 2018.
But you know what?
That won’t stop sellers and listing agents from trying. I just sure as hell hope none of the folks reading this fall into that camp…


Ralph Cramdown
at 8:21 am
Here, let me Seasonally Adjust that for you…
ed
at 9:23 am
Too funny!
Appraiser
at 9:13 am
The TREB numbers are in for MAY.
Year over year:
Sales down 22.2%
Average price ($805,320) down only 6.6%
New listings down a whopping 26.2%!
Inventory is shrinking.
Cant see prices dropping much in this environment.
Chris
at 9:20 am
Active listings up 13.2% year over year.
So much for shrinking inventory.
Appraiser
at 9:35 am
When the decline in new listings is outpacing the decline in sales, inventory is shrinking.
P.S. last May new listings were up 48.9% year over year from 2016. This year new listings are down 26.2%.
That’s a huge swing in market dynamics.
Chris
at 9:44 am
“New listings is a bit of a garbage stat as TREB tracks it. Last year had tons of terminations and relistings, making “new listings” very distorted. I pay way more attention to active listings, which are real.”
– Scott Ingram, May 10, 2018
Look to Active Listings, MOI or SALR to measure inventory.
Housing Bear
at 10:48 am
Also remember that last May was the first full month of post fair housing plan. New listings spiked big time YOY from 2016, and sales dropped off considerably (YOY and MOM from April 2016. Normally May has more sales and higher prices than April )
Meaning that, todays sales numbers are down YOY from a benchmark number that had already been down. New listings are being compared to the huge spike we saw last May………. The industry always said it was not fair to compare prices and sales to the record numbers from Q1 2017. Yet now if you look at Toronto Real Estate headlines on google almost everyone references how new listings are down big time …………. At this point I find it kind of cute actually.
Professional Shanker
at 12:56 pm
cute, I prefer deceptive…..
ed
at 9:23 am
Re new listings down 26.2%, down quite a bit from last year but last year was a strange year. I think it would be more telling to see how the number of new listings compares to the average (May) of the last 5 years or so.
Kyle
at 9:52 am
Prices are no longer dropping, they are coming back to the 2017 levels. When you look at Y/Y March 2018 was the bottom and you can see the recovery taking shape:
GTA Prices
May Y/Y % -6.6%
Apr Y/Y % -12.4%
Mar Y/Y % -14.3%
416 Prices
May Y/Y % -4.2%
Apr Y/Y % -8.3%
Mar Y/Y % -9.1%
I was premature to predict 416 prices will be back to black in May, but June is looking more and more like a solid bet (short of anymore crazy new rules). If you look at Zolo today, 416 is only down only 0.2% (basically a rounding error) from where prices were last year.
Chris
at 10:00 am
“short of anymore crazy new rules”
I think much of this will hinge on the election results come Thursday.
http://torontosun.com/news/provincial/ndp-propose-whopping-new-housing-speculation-tax
Appraiser
at 3:59 pm
But the bears contend that there is no such thing as a controlled landing.
It’s chaos 24/7 with these guys.
Chris
at 4:03 pm
Nope, that’s just your caricature of anyone who doesn’t share your bullish opinion.
Housing bear
at 4:28 pm
Please provide an example of a controlled or soft landing. I can think of 1 or arguably 2 examples in modern western world economic history where the ECONOMY had a soft landing after a certain asset class imploded but never 1 where an inflated asset class had a soft landing. The worst possible bubble for the economy is housing because it impacts everyone and serves as a huge drag on consumer spending which is the crux od developed economies. Huge corrections in the stock market for example only impact those with stocks and generally are not as leveraged positions.
@kyle
I was specking average to be a fair bit higher than the 805k reported. Normally May beats April by more than that ( April was 804k also normally May marks the high for the year). June is normally lower than May. Only needs to give back 12k on average this month to below June 2017. I think we might be “back in the black” for July and or August but this will not hold up through September.
Appraiser
at 7:30 pm
@Housing Bear: You want an example of a soft landing? You just witnessed one.
Housing bear
at 9:44 am
Sure if it stops here or in the next few months, and prices stay flat for the next 10 years until true fundamentals catch up, then yes this would be an example. The first ever and Poloz will win awards.
Appraiser
at 5:02 pm
Heres another obvious downtrend. Year over year active listings:
Feb. +147.4%
March +103%
April +40%
May +13.2%
Chris
at 5:27 pm
Active listings are now only up double digit percentages instead of triple digits!
Can’t fault you for being a glass-half-full kinda guy.
Housing bear
at 9:49 am
Again, comparing to record low inventory from jan-match 2017. Listings picked up a bit in April 2017, then exploded in May 2017. I actually thought the YOY numbers would stack up better this may.
Marina
at 9:23 am
David, what would you do if you had a listing with an offer date and the offers just did not materialize?
Like, what is the “optimal” way to handle that type of situation? Clearly the above ways are dumb, but I’m curious how it should be handled.
And let’s assume the offers didn’t materialize for a legitimate reason – i.e. not because the seller was batsh*t crazy, but because maybe there was a weather event, or a similar house went for sale at the same time, or maybe people just didn’t like the house or whatever. What’s next?
Real estate millennial
at 9:56 am
Call the lender that last held their mortgage and get them to appraise the property. The homeowners won’t take the agents opinion simply because they’re the agent and a “salesperson” with a interest in the property. The appraisal will come back lower than the price you suggested as the agent because they use the previous 120 days comps which usually lags behind the current market (in an upward trending market). But now you a have better chance of getting the list price you want. Tough seller 101.
Frank
at 4:50 pm
Youre right. There’s way too many spec sellers that still think they might get a seller stupid enough to pay his ridiculous price and on top of that an agent who’s willing to go along just to get a listing.
Buyers are cautious cause they dont know when prices will bottom out and sellers are in denial or too greedy and delusional to accept today’s market. Its going to take a while before both sides are in sync
Professional Shanker
at 6:32 pm
David – How about a post related to the election this Thursday – If the NDP squeezes this one out I honestly believe RE values take a 5 to 10% haircut in the 2nd half of the year, speculators holding on with sell in order to de-risk some of their portfolio….good news for you is that the PCs should win handily and that is even with Dougie at the helm!
Housing bear
at 9:59 am
@kyle and @ appraiser
Another down trend
Total dollar volume gta jan-may 2017 = 41.4 billion
Total dollar volume gta Jan-may 2018= 25.1 billion
A 39.4 decrease
You see we have had a massive over supply of cheap credit and not enough people to obsorb it wff
Housing bear
at 10:03 am
Woops hit post too quick
Absorb it efficiently. How much is something worth, normally what someone is willing to pay for it. How much is real estate worth, what some one is willing AND able to borrow for it.
Money supply tightens, less money to be lent out to the next buyer who you want to buy you out at a higher price.
How big of a price correction is to follow is dependent on a combo of how many people will have to sell into it this market do to life events and more importantly, how much bad debt is out there.
Sales and dollar flow lead prices
Kyle
at 10:21 am
That may be your interpretation, but i don’t see anything concrete behind that conclusion. In my view there are other much more probable reasons for low volumes, including, a lack of good listings. Like i said in Toronto proper, we’re basically where we were at last year in terms of price, despite volumes being down, but that has as much to do with lack of supply.
Either way i put very little weight on sales volume. Prices are set by Supply and Demand – full stop…Not by volume. If volume goes up or down, it doesn’t mean prices follow.
Housing bear
at 10:30 am
Prices are set by supply and demand full stop when credit is removed from the equation. Once added then price support is determined by demand+ that demands access to credit.
In regards to low sales due to lack of good listings. Last year, jan to march 2017 we had record low supply, near record sales, and record price appreciation.
Kyle
at 10:41 am
What I mean is Demand is a function of credit. Credit isn’t it’s own tertiary factor. So it’s fair to say that reduced credit can constrain demand. but how much it translates to prices depends on what supply is available.
If demand and supply are both falling, then either or both will reduce volumes, but not necessarily prices.
Chris
at 10:48 am
City of Toronto Detached May Statistics:
Sales – 782 (lowest in seven years)
Active Listings – 2,306 (second highest in seven years)
http://torontorealestatecharts.com/2018/06/05/may-2018-detached-city-of-toronto/
“Lack of good listings” is a qualitative statement. Number of active listings and SALR are quantitative metrics.
Kyle
at 10:56 am
416 Inventory is currently at 6,419
416 Inventory at this time last year was 6,581 (a time when there was ridiculously low inventory)
Chris
at 11:05 am
City of Toronto Condominium Apartment May Statistics:
Sales – 1,745 (2,038 last year)
Active Listings – 2,552 (2,509 last year)
http://torontorealestatecharts.com/2018/06/05/may-2018-condominium-apartments-city-of-toronto/
Detached inventory has climbed significantly in tandem with sales volumes falling, while condo inventory has remained low and sales volume has stayed around average.
City of Toronto Detached May SALR: 35%
City of Toronto Condominium Apartment May SALR: 63%
Housing bear
at 11:35 am
May 2017 saw a huge spike of listings actually. The record lows in inventory ended in March 2017.
And sure, theoretically even if credit dried up 100%( won’t happen), and therefor no one could afford to buy anything unless it’s straight cash, prices would stay flat if very few decided to list and sell…………HODL!
I touched on this above. This would require a minimal amount of people having to sell due to life events. Deaths divorce etc. Most boomers not being dependant on the sale of their home to fund retirement ……………. and very few overleveraged households out there susceptible to any disruption in their income or debt costs……… I guess it is possible but if any of those groups crack and fire sale it could set off a pretty big chain reaction.
I will also point out that all of the doom and gloom predictions I have made here over the past couple months was under the assumption that nothing bad would happen with NAFTA. This could lead to higher prices for most consumer goods (inflationary) and put more pressure on the BOC in the short term to raise rates to strengthen our dollar
Kyle
at 11:53 am
@ HB
I think we fundamentally disagree on the financial resilience of buyers. Sure, if buyers are mostly made up of bad-debtors and maxed out folk then i follow your reasoning, but at this point i don’t see any real evidence of that. What i see is a reduction in the maximum amount of credit available to households, which translates to a small portion of people spending less on real estate than they ordinarily would have planned to. From an affordability/credit worthiness stand point, every piece of data i’ve seen on the profile of mortgagees (i.e. not articles based on sentiments, anecdotes, opinions or misinterpreted renewal stats), has shown that most are actually in good shape to weather gradual rate increases. And that the successive tightening of qualification standards on an already conservative population has only made the chances of a major correction all the more remote.
Ralph Cramdown
at 10:35 am
“People depend on the overall housing (market) to be healthy to feed their families” — TREB president Tim Syrianos
Chris
at 11:50 am
Kyle,
Out of curiosity, do you still stand by your prediction that the GTA Average Home Price will “retest or surpass the $921K we saw in April” in 2018, now that much of the Spring market is in the rear-view and the metric is at $805K?
https://torontorealtyblog.com/archives/20377#comment-80466
If so, what would you qualify as “retesting” that high water mark? Average price being within 5% (>$874K)? Being within 10% (>$829K)?
Thanks.
Kyle
at 1:04 pm
I think it depends on what happens in the luxury market. My prediction was based on volumes increasing in the $2M+ bracket, it hasn’t happened yet, but could still happen in the fall. If average prices get back up to the 900’s, then i think it’s fair to say that it has been retested, if it doesn’t happen in the fall then i will have been wrong.
Chris
at 1:42 pm
Agreed, $900K is a fair level at which to say last year’s high has been retested.
Appreciate the clarification. We’ll just have to wait and see how the prediction turns out!
Ralph Cramdown
at 4:05 pm
Begging the Question…
I’m curious as to peoples’ thoughts on David’s critique of the serial relister/repricer. David’s thesis is that this strategy(?) is a mistake, but, by not presenting any evidence, he begs the question. Yes, it sure looks like the seller is confused or misreading the market, but is he? Not to focus on David’s example, because I really don’t know enough about it. But I see different strategies employed all the time, often by top agents for pricey properties. A recent one in my neighbourhood ran a Dutch auction, lowering the price in steps over eight months (didn’t sell). Another one has just planted a sign on a $4m+ new build about which an optimist would say “still time to pick your personal finishes.” Little piece of tape over the MLS logo on the sign, no sign of the property on the agent’s website, or his broker’s. Observation indicates that David prefers the ebay approach to selling most of his listings, even the pricier ones: Take pretty pictures, list low and run a seven day auction. Obviously, there are advantages; if two or three bidders show up, the seller finds it hard to complain, and the place gets sold quickly so no chance of losing the listing to expiry or second guessing the pricing. But other agents — even very successful ones — take a different approach, even with clients who, if not proven real estate geniuses, are at least crafty enough to have somehow amassed considerable wealth.
Any thoughts on which is the best listing strategy, in “today’s market” or any other? Any one know of any scholarly research on real estate pricing strategies?
Not Harold
at 6:12 pm
Not sure that scholarly research would really apply – what works in the core in 14 doesn’t work in Courtice and wouldn’t have worked in the core in 92, nevermind in Montreal, Calgary, or Saskatchewan.
David doesn’t really seem to be competing in the 4MM++ range and his approach and advice feels targeted to the pure commodity market (condos) and the reasonably commodity market of homes up to about 2.5MM. In these markets you have to accept that you’re not a unique creature but are offering x beds on a y ft wide lot in z school district. Too many people get caught up on a specific price, ignoring the holding cost. If you have already bought a new house, speed is the best thing. If you’re in a falling market, speed is the best thing.
David’s approach seems optimal for the current market and he seems to be focused on what works today to get clients the most money the fastest or the most house the fastest (for buyers). I hope that his approach and advice would change if we were in a very different market (the 80s historical posts noting the popularity of vendor takeback mortgages indicate that he would).
If you’re selling a truly unique property – like Peter Munk’s former house in Forest Hill – then you have to do something very different. But most Toronto houses are commodities even if the prices make them feel like Rembrandts. There are a few pricing (and development) mistakes on the market right now in Lawrence Park and North Rosedale. Houses sit for weeks while others at similar price points go in a few days. I believe that this validates David’s approach and underlines that it requires honest self assessment on the part of the seller – how does your house TRULY compare to the market? If you skimp out on landscaping the backyard on a brand new $5-6MM house, you’ll be punished. If you over ask for the house, you’ll sit while one a few hundred feet away that is truly perfectly done will disappear in hours.