

The answer to the question: The Lovin’ Spoonful.
Actually, the answer to the question could be “town,” not time.
It depends on the question you’re asking, of course.
If you’re asking, “Who sings the famous song, Summer In The City?” then the answer is The Lovin Spoonful.
If you’re asking, “Does the first lyric of the song say ‘hot time‘ or ‘hot town‘?” then the answer is the latter.
Shame on me for always thinking it was the former, but doesn’t it sound like “Hot time, summer in the city?” to you? And wouldn’t that be a better lyric?
Maybe not.
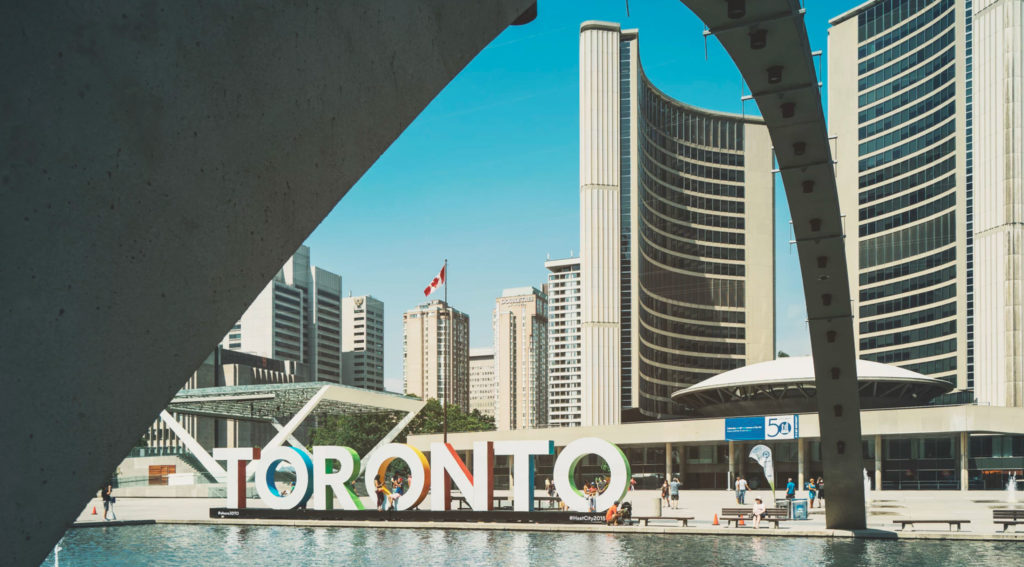
Maybe it’s the town that’s hot. Maybe it’s Toronto that The Lovin’ Spoonful were talking about when they wrote this song in 1996. After all, band member Zal Yanovsky was born and raised in Toronto.
In any event, if I had to choose a song to best describe last week, it would be this one.
Honourable mention to Nelly’s “Hot In Herre” from 2002 (that wasn’t a typo in herre by the way, but rather it’s apparently cool to misssppelll things…).
You might vote for Don Henley’s “Boys of Summer” if you’re slightly older than me, or perhaps Calvin Harris’ “Summer” if you’re younger.
I suppose the Violent Femme’s “Blister In The Sun” might accurately describe last week, but you’d have to be an extremely upbeat and positive individual to use the 1980’s classic, “Walking On Sunshine” by Katrina & The Waves as your theme song for Toronto’s heat wave.
No, I just don’t think I can find a better lyric to describe Toronto over the “long weekend” that wasn’t a long weekend than this:
Hot town, summer in the cityBack of my neck gettin’ dirty and grittyBeen down, isn’t it a pity?Doesn’t seem to be a shadow in the cityAll around, people lookin’ half deadWalkin’ on the sidewalk, hotter than a match head
If there’s one thing that I love about long weekends in Toronto it’s that so many people escape the city, and the pace slows down.
In some places, it’s empty.
“Doesn’t seem to be a shadow in the city” describes that.
As for the heat last week, I do believe that people were “lookin’ half dead” and “walkin’ on the sidewalk, hotter than a matchhead.”
In some ways, we deserved that heat wave.
We did a lot of complaining about the winter, remember?
As I stood in my driveway on Canada Day, watering the lawn out of fear that the sprinkler alone wasn’t enough to beat the heat, I couldn’t help but envision myself on this same driveway, only a few months earlier, digging out three feet of snow.
It felt like I was just digging my car out from its plowed-in position on the street.
But alas, it’s July! And those winter storms of January and February are well behind us.
Having said that, I do see a parallel between the dregs of winter and the scorching heat of June and July. Just as the market slowed in the dark, dreary, snowy winter months, and buyers remained at home, unmotivated to go outside, I see the buyer pool being equally as unmotivated right now.
It’s nice outside! There’s stuff to do!
Softball, beach volleyball, special events, and drinks on the patio. World Cup parties, afternoon spent golfing, and cottages. Oh, cottages galore!
For the record, I do none of these things. It’s hard to be alone in the corner of your basement and be out socializing in warm weather, which is why my efforts are firmly directed at the former.
But other people do. Normal people do.
Buyers, sellers, agents, and other real estate market participants are out soaking in the sun, and I felt this ripple through the Toronto real estate market shortly after we turned the page to June.
Last month in this space, I talked about how the market usually “peaks” in the month of May.
Looking strictly at the first six months of the year, we’ve seen the average home price reach its highest point in the month of May, more than any other month.
I asked last month if it were at all possible that we would see the market peak this year in June instead, but it was unfortunately not to be…
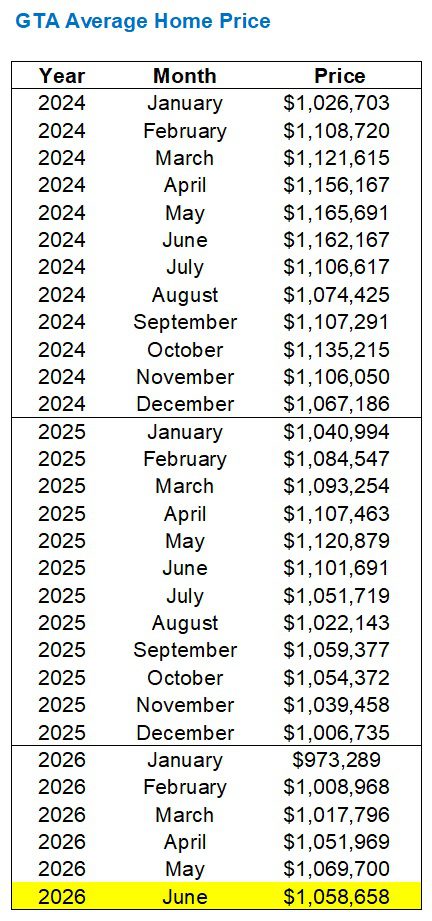
The average home price declined by 1.0% last month, which marks the first time in 2026 that we’ve seen a month-over-month decline.
But as we’ve discussed, this almost always happens.
In the previous twenty-four years, the average home price has declined from May to June twenty times:
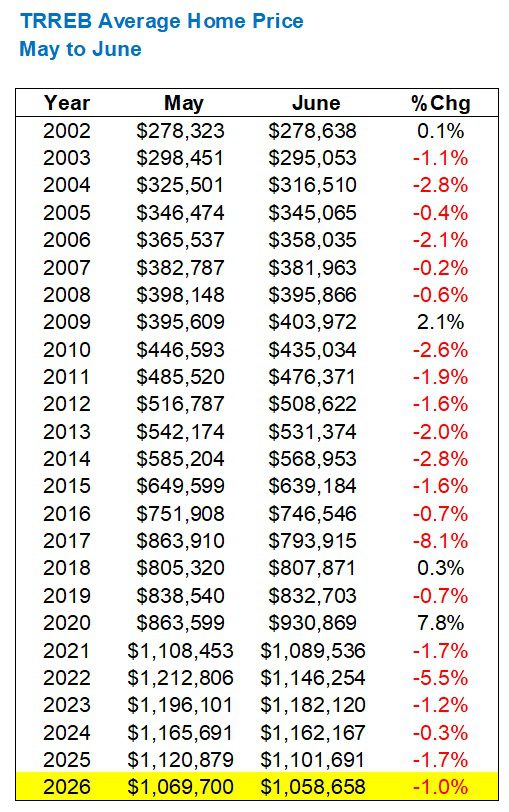
The average monthly movement is -1.2%, so last month’s decline is perfectly in line.
As for the “peak” discussion, we can now fill in our chart:
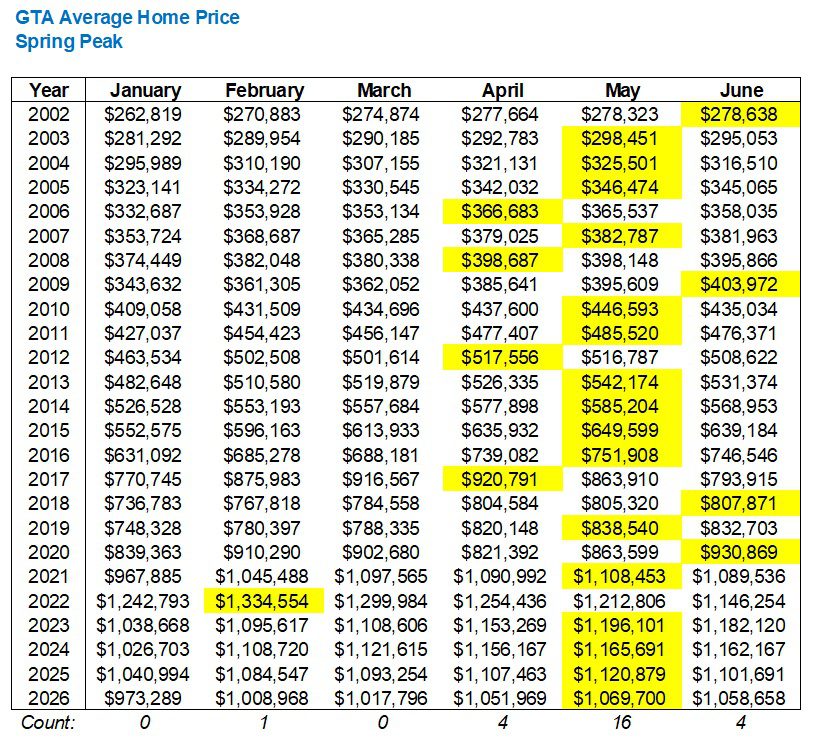
You could almost set your watch to this, right?
It’s automatic.
Having said that, this does not mean that “If you list your house in May, you’ll get the highest price.”
I know, I know, that’s not making much sense, and I don’t have data to prove that.
But I’m thinking of a listing that I had in March, which I sold for $1,400,000.
If I had that property for sale after Victoria Day weekend, I kid you not, I think I would have got $1,200,000.
Every market segment is different, and to paint the entire market – condos, houses, low-end, high-end, renovated, unrenovated, east, west – all with the same brush, is naive and lazy. A good real estate agent, while not being able to “predict the future,” will usually know when is a better time to list, and when it isn’t, depending on the product.
Now, what I find the most fascinating in terms of June’s average home price is how it relates to 2025. Specifically, when we compare how every other month of 2026 has compared to 2025.
Does that make sense?
Look:
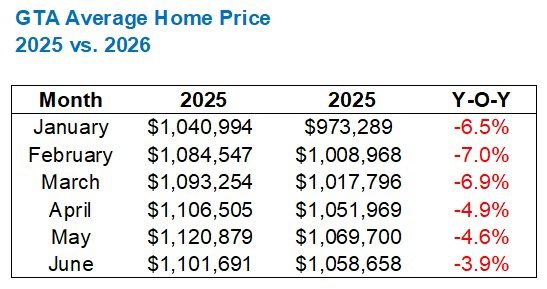
That’s a “trend.”
The gap between 2025 and 2026 is narrowing, and about this, there can be no doubt.
The following chart might illustrate this better for you, or not. We all take information in differently:
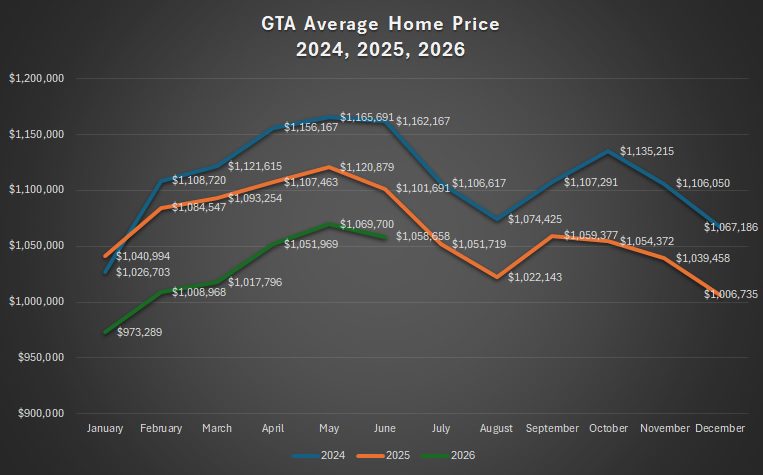
Some of you will look at this chart and say, “The market sucks. Look how far behind 2026 is, compared to 2025, then compared to 2024.”
Sure.
But you could also look at the gap between our green and orange lines from February through April, and compare it to the space in June.
Is the market playing catch-up?
Sadly, I don’t put much stock into July and August stats, so I won’t really be able to conclude if we’re seeing a catch-up until the fall. But it doesn’t mean I won’t try next month!
As for sales, we saw 6,770 homes trade hands in the month of June, which, on its own, provides little context.
Up against previous years, however, we can make some observations:
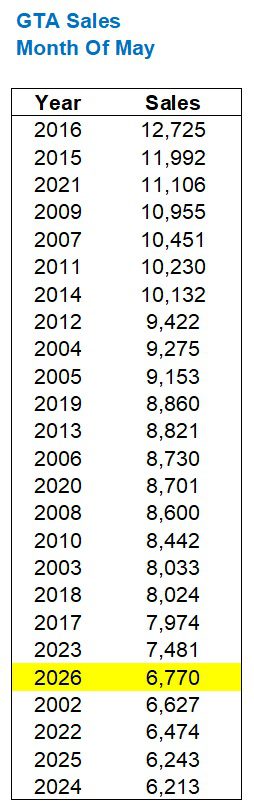
Well, that’s an 8.4% improvement over sales in June of 2025, but it’s still fifth from the bottom.
What I found interesting about the sales data, however, was the month-over-month movement.
Compare previous years:
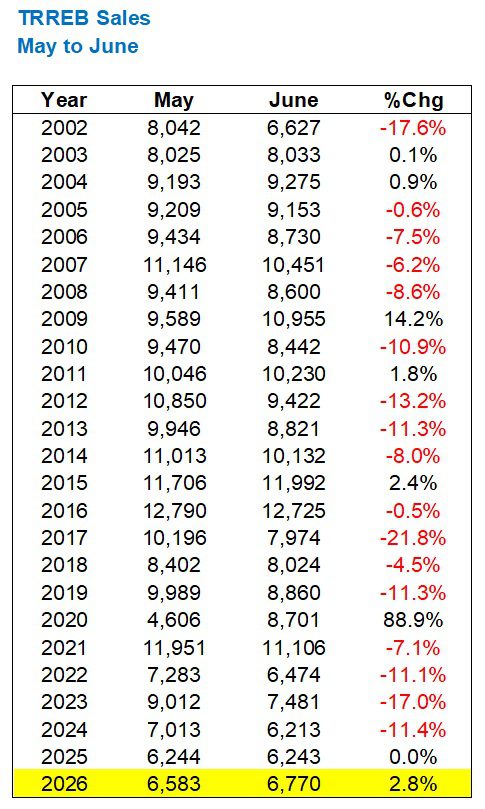
Seventeen times in the previous twenty-four years, we saw sales decline from May to June.
In fact, the average movement from May to June, from 2002 through 2025, is -7.9%.
But we saw sales increase by 8.4%.
That’s a sign of strength, in my opinion, and as we were asking if the market was “playing catch up” in the section above, perhaps this is another positive indicator.
Throughout 2026, I’ve been talking about whether or not we would set a “new low” in sales.
Recall that in 2023, we saw the fewest sales since pre-2000.
Then in 2025, we set an even lower bar.
To start the year, the months of January and February were telling me we could see even fewer sales in 2026. In fact, while it was only two months of data, it told me that if things stayed the same, we’d see a decline of 10% from the already-low figure in 2025.
But sales increased over 2025 in each of March, April, and May, and that trend continued last month:
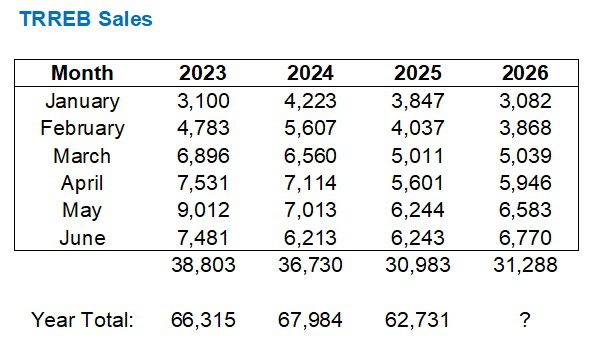
It looks as though we’re pacing for around 63,349 sales, based on the activity in 2025 vs. 2026.
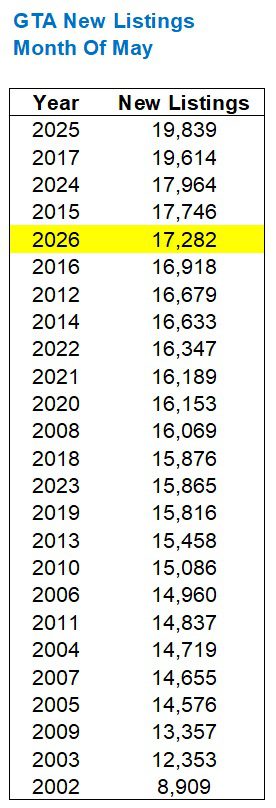
New listings always seem to peak in the month of June, which is ironic, considering we know that the market slows down after Victoria Day.
There were 12.9% fewer new listings last month than the record set in June of 2025, and fewer than the figure from June of 2024, but still the fifth-most since 2002:
I wonder how many of these were re-lists, since so many agents had failed offer nights in June as the market slowed down and they refused to re-strategize, but unfortunately, we don’t have access to the re-list data anymore. If only TRREB hadn’t decided to take it away from us back in 2024…
The sales-to-new-listings ratio last month was very poor, but at least it was better than 2024 and 2025:
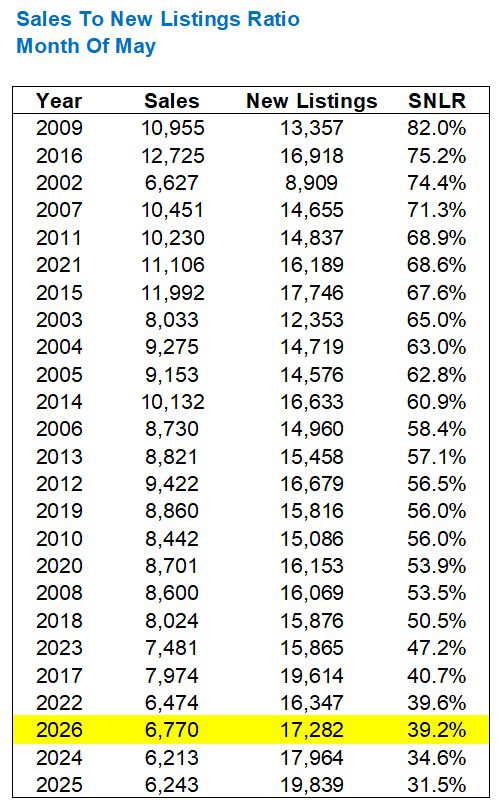
I would agree that 39.2% signals a “buyer’s market” overall, but we’re not seeing that in certain geographic and/or price points in our market.
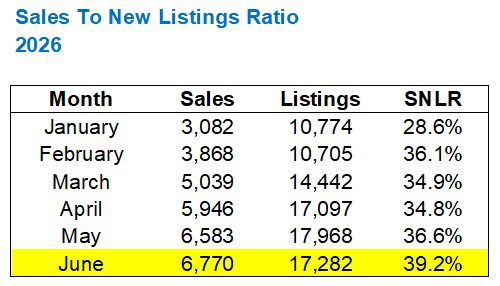
And while an absorption rate of 39.2% hardly provides confidence in the market, the trend has been going up.
In fact, despite a decline in the average home price last month, the absorption rate peaked:
And now, we settle into the much-deserved summer months!
As we all know quite well, the summer is short. But it’s beautiful, so take advantage.
I, for one, cannot believe it’s been twenty-three years since Nelly gave us “Hot In Herre.”
Consider this lyric:
Its gettin hot in here (so hot)So take off all your clothesI am gettin so hot, I wanna take my clothes off
I was twenty-two years old when this song came out. Back then, these lyrics conjured up images that are NSFW.
And today?
Today, these lyrics conjure up images of my children running through the lawn sprinklers in 36-degree heat.
Funny how times change, isn’t it?
























Serge
at 9:10 am
15 years ago Garth was very pessimistic about Toronto RE, and David was optimisitc.
Now, Grath is all for buying RE, and David is more cautions.
Times, they’re changin’
JF007
at 10:37 am
David how about seeing price breakdown by housing type to see what trends and stats says when we compare 2024 v ’25 v ’26, trying to see if there is a correlation on what drags the numbers downwards.