

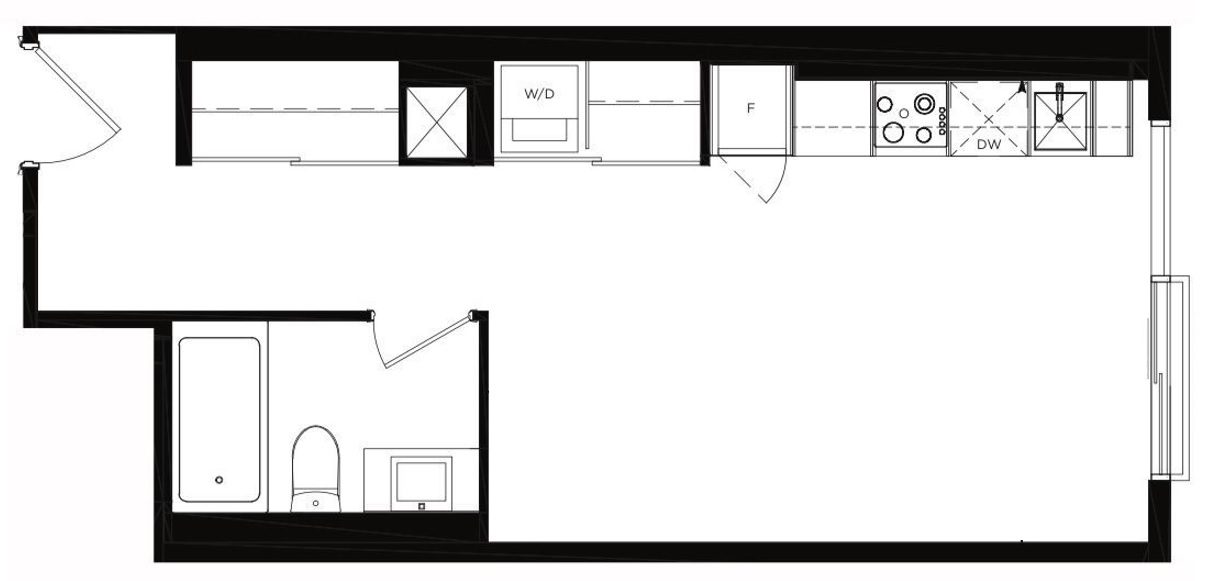
Last week, I sold a 390-square-foot condo.
It was tiny.
It was a bachelor condo that had, believe it or not, a very long front hallway, which, as we know, makes the “living space” a whole lot smaller.
Can you picture what 390 square feet looks like?
I know, I know, for some of you, it’s the size of your master bedroom.
But for those of you who can’t picture it, let me help you:
The crazy part was, this condo only took 13 days to sell!
But do you want to know what’s crazier?
This condo was 19.2% larger than a unit we sold the week prior.
I’ll save you the math on this one, folks. We sold a condo two weeks ago that measured in at 315 square feet!
That one was tougher to sell, not only because of the size, but also because of the location.
Not only that, most buyers worry that banks won’t finance condos this small, so it left us with a buyer pool comprised of people looking to buy in cash.
Every one of them knew this, of course.
Every agent told me, “You know most buyers won’t even look at this. But my client is all-cash…”
I did what I could to provide an objection, but I really didn’t have a lot of leverage.
Condos are selling out there right now, however. It just takes a lot more work than it ever has before.
I had a great conversation with an agent last week who said she was going to get me an offer on one of my condo listings.
I told her, point blank:
“I will get you a sign-back, no matter what your offer is. You could offer us $1.00, and I will give you a sign-back.”
Some of you will argue that I’m looking desperate or showing my hand, but I’m not. Er, not showing my hand, per se, but rather extending it.
It sounds cheesy, but I asked another agent, “If I extend my arm and show you my hand, will you shake it?”
The only way that condo deals are getting done in this market is when you have four parties, all trying to achieve the same goal. The buyer, seller, and both agents need to work together, and the moment that somebody’s ego gets involved, the deal blows up.
For what it’s worth, the agent I mentioned above – the one I told I would get a sign-back to, even if her offer was a dollar, sent me a really bad offer. But after six rounds of sign-backs over the course of seven days, the deal was done.
Say what you want about the Toronto condo market right now, but deals are happening.
Not only that, inventory has declined substantially from last year.
We last discussed this in the beginning of April, but now that Q2 is on the books, I’d like to look at the 416 and 905 condo markets and see what, if anything, has changed.
Here’s the 416 condo listings:
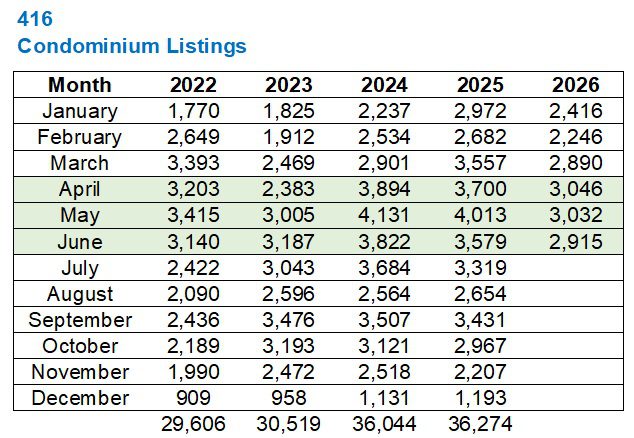
Let’s focus just on 2024 – 2026, for a moment.
Notice that, in 2025, listings were up substantially over 2024 in the first quarter.
That’s 33% in January, 6% in February, and 23% in March, before we see the market shift in April and suddenly listings are down.
When we compare 2026 over 2025, we see a decline of 19% in January, 16% in February, and 19% in March.
In Q2, the trend continued, but the figures were higher: down 18% in April, down 24% in May, and down 19% in June.
All told, we’re on pace to see twenty percent fewer condo listings in the 416 in 2026 than in 2025.
That’s 29,271 condo listings.
That’s fewer than 2022.
This is the largest takeaway I have from the Q2 data, folks.
Here’s how our data set looks graphically:
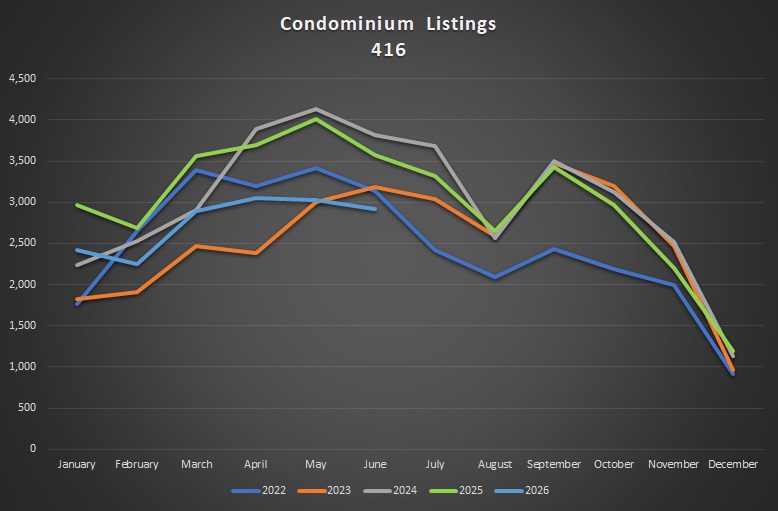
Pay special attention to the month of June.
Listings in June were lower than 2022, 2023, 2024, and 2025.
This is something to monitor as we move forward.
In terms of sales, I notice a major shift in the trend from Q1 to Q2.
Can you see it?
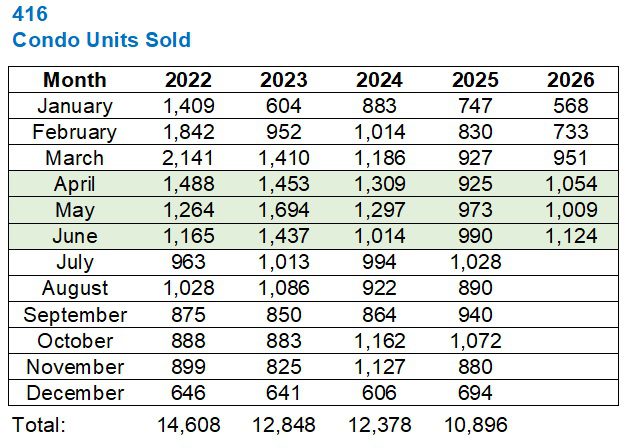
Unit sales were down by 24% in January, 11.7% in February, and then up modestly 2.6% in March.
Unit sales were up by 13.9% in April, 3.7% in May, and 13.5% in June.
Through the first six months of 2026, condo sales are 0.9% higher than the first six months of 2025.
I think we would agree that 0.9% isn’t much to get excited about, but it’s the trend that interests me:
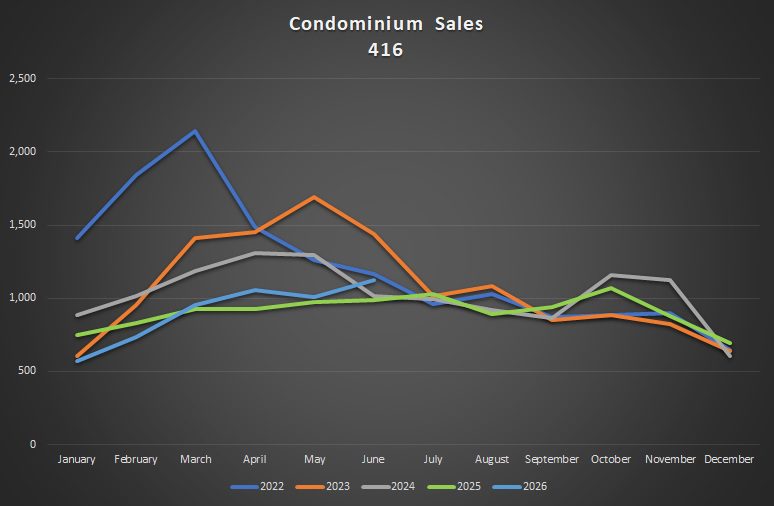
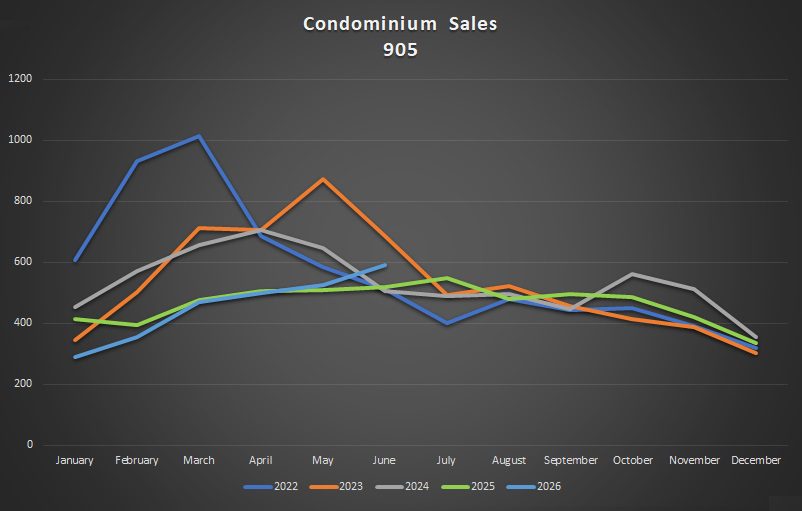
It takes a special kind of focus to not look at January, February, and March of 2022 in this chart above, so don’t worry if that’s where your eye went.
Not only that, the unit sales in Q3 and Q4 are so tightly bunched together that it’s almost not worth looking at.
Well, that is, until we get the Q3 data, which I think will show that light blue line breaking free of the pack…
Let’s look at the 905 now and see if there’s a difference:
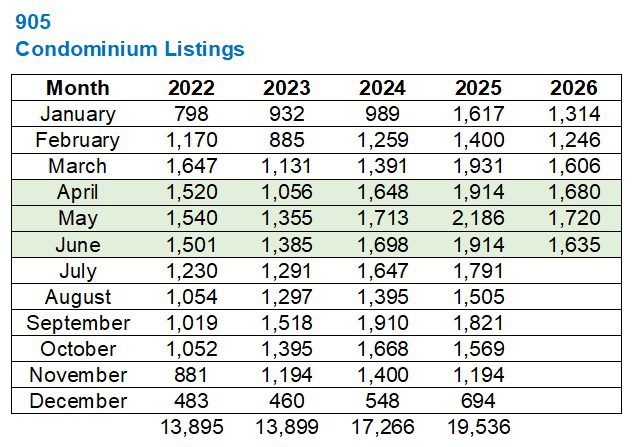
There’s a little variation from the 416 data set, but not a ton.
In fact, if we put the year-over-year listing movements side-by-side, it would look like this:
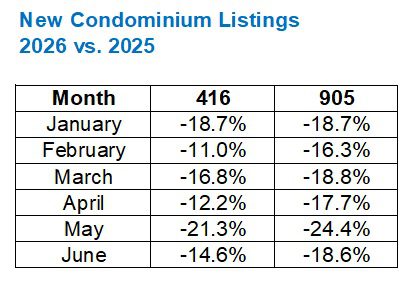
2026 started with identical year-over-year declines in inventory in January, but since then, the listings have declined at a higher rate in the 905.
Here’s how listings look graphically, and notice there’s one big difference from the 416 graph:
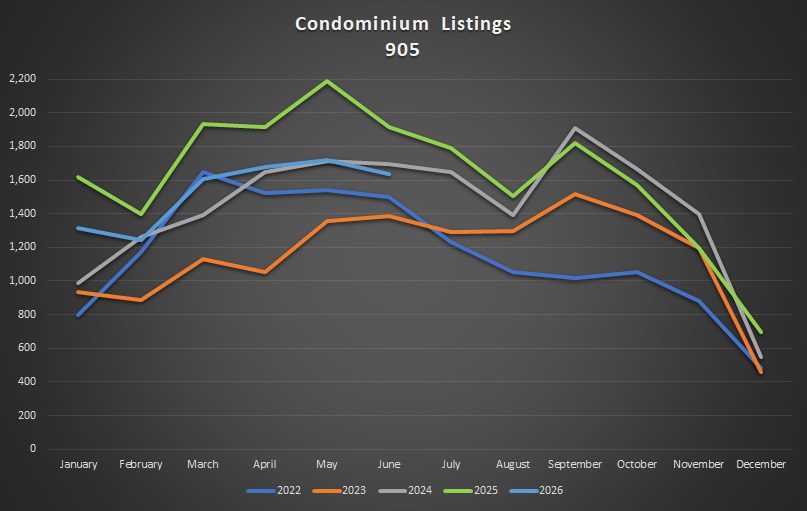
In the 416, we saw inventory hit a trough in June.
But in the 905, inventory trails 205 and 2024, but is still above 2022 and 2023.
When it comes to sales, the 905 trails as well:
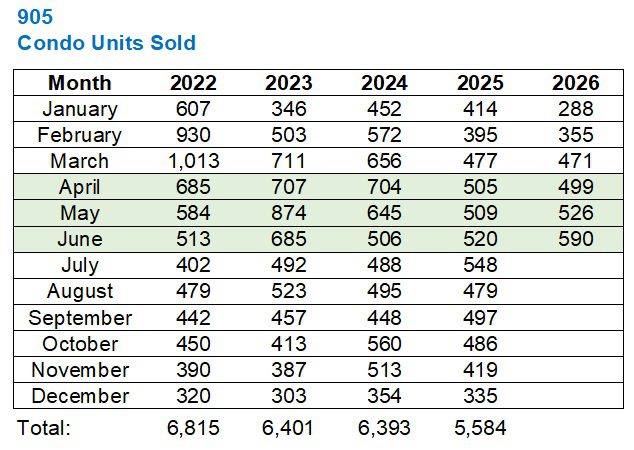
The pattern here is quite similar to the 416.
The year started with very poor condo sales in January, and that continued into February, before the tide turned in March.
But as the following comparison shows, the trend changed earlier in the 416 than in the 905, and it was more pronounced:
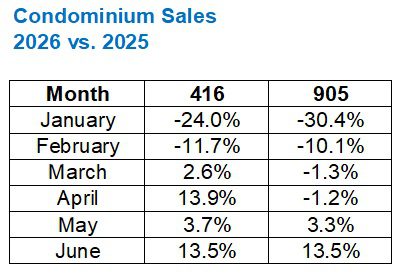
Two major differences here:
1) The year-over-year decline that we saw to start 2026 was more pronounced in the 905 than the 416.
2) The turn from negative year-over-year figures to positive happened in March in the 416, but it took until May to happen in the 905.
Having said that, sales in June are at the second-highest level in the past half-decade:
Now, put all this together, and we look at the absorption rate.
The absorption rate is often used to determine if a market is a “buyer’s market” or a “seller’s market,” based on the 50% threshold.
That would speak volumes about the following chart…
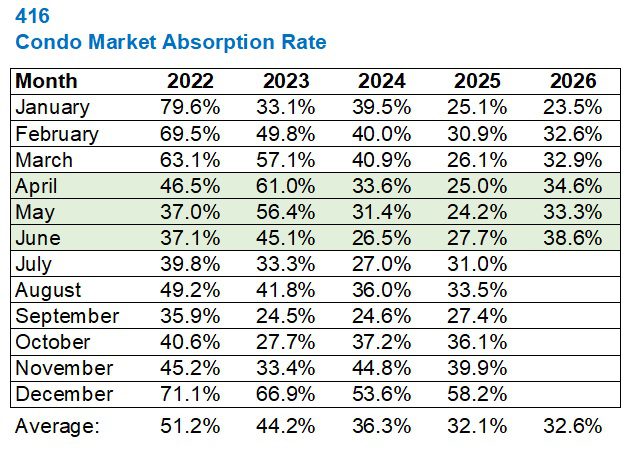
Yes, it’s been a buyer’s market in the Toronto condo market for quite some time, although I wouldn’t say that any point in 2022 was a “buyer’s market,” despite what the stats say above.
Regardless, I want to draw your attention to January of 2026.
The absorption rate fell to 23.5%, which is the lowest I have ever seen in the 416.
However, in each of the next five months, the absorption rate in 2026 was higher than 2025, and it was almost 11% higher by June.
An absorption rate of 38.6% isn’t much to get excited about, but it’s higher than June of 2022 when the market was a lot better.
The chart speaks volumes as well:
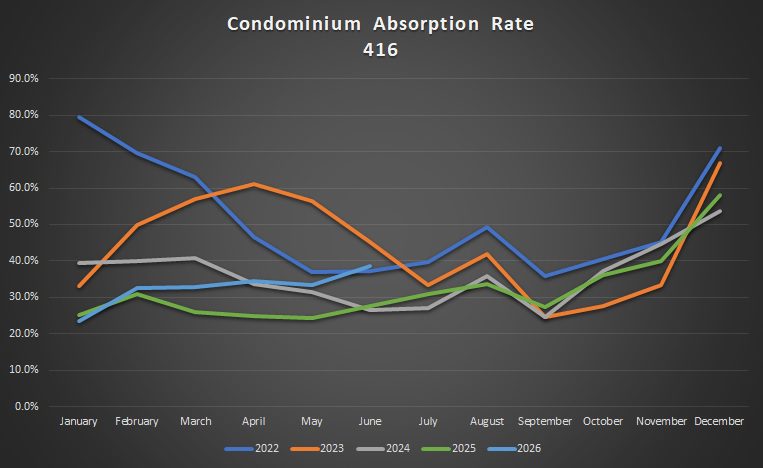
Okay, maybe not “volumes,” but the trend in 2026 is up, whereas almost every other year saw the trend going down by June.
The same is true of the 905:
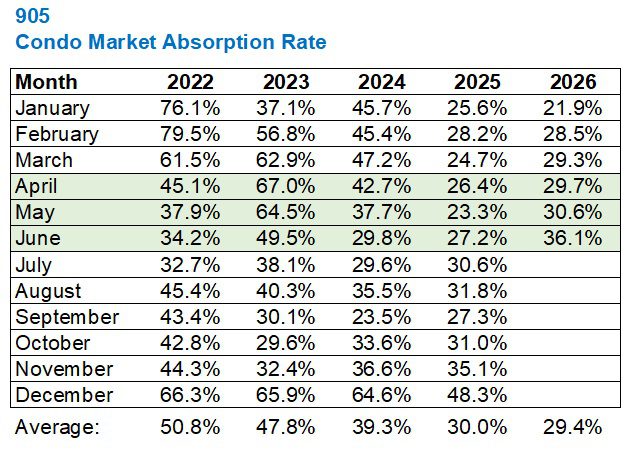
Geez, remember January?
21.9%.
I remember writing about this statistic and just how much it blew my mind.
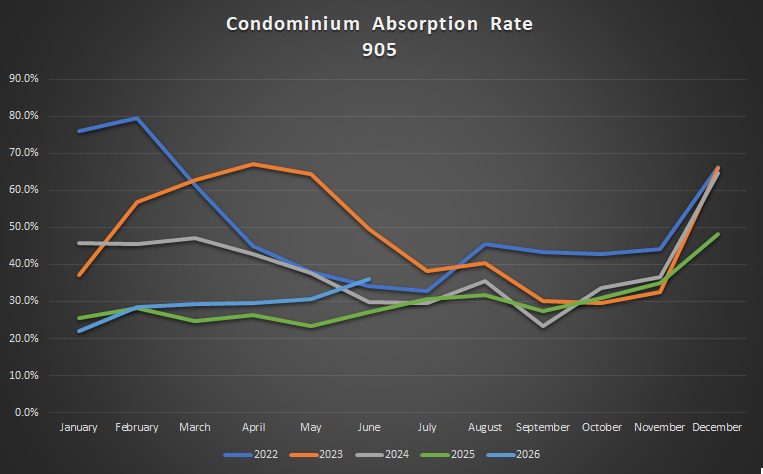
Well, the absorption rate is back up to 36.1%, and for those of you who think that it’s always higher in June than January, you’d better look back at the previous four years.
As for our trendline, it looks similar to the 416:
Now, at the risk of adding one or two many charts, in previous iterations of this topic, the TRB readers have often asked, “What about prices?”
There’s no question that condo prices are lower than last year and the year before, but by how much?
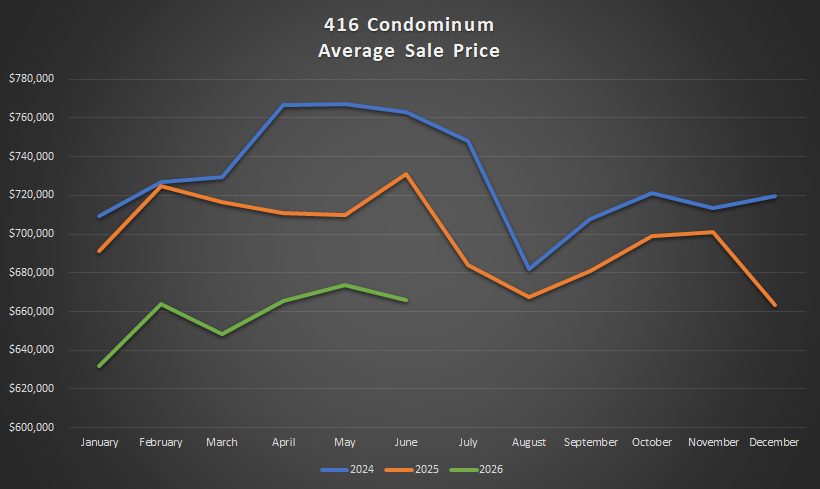
That’s just the last two years. Trying to keep it clean!
In 2024 and 2025, the average home price plummeted in the summer.
That is what I’ll be keeping an eye on as we move forward.
As for the 905, look at the downtrend in 2025, first and foremost:
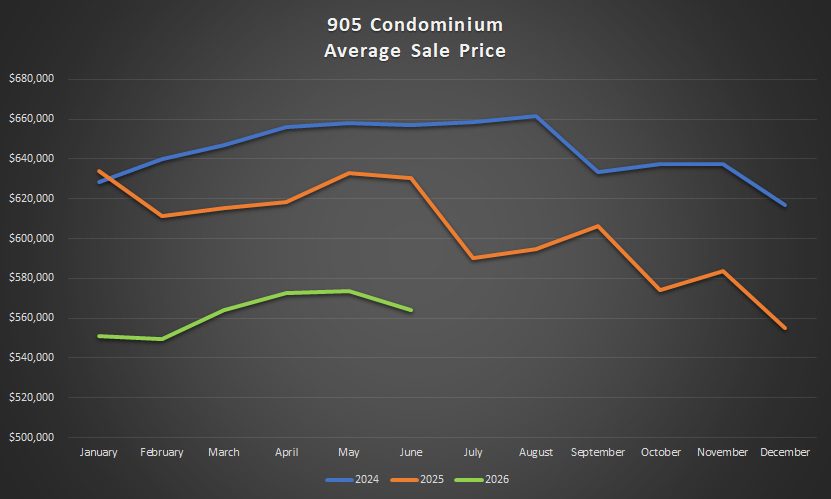
That was a wild ride!
But will 2026 follow suit?
–
Alright, if you made it through these sixteen graphics, bravo, but I’m wondering just how bad your weekend was that you wanted to be back at your desk on Monday morning, looking at real estate charts?
Well, not “bad,” but, you know, busy. There’s just a lot going on with the children…
Oh yes, the children, this time of year.
Raise your hand if you’re secretly thinking, “The school year wasn’t that bad. At least they were out of my hair for seven hours a day…”
Happy Monday, folks!





























D Danyluk
at 12:35 pm
Tell us what the two small condos sold for. If it sound like a good deal, maybe you’ll get more people interested. Just saying you sold the propertys without a price really doesn’t mean much.
Serge
at 10:23 am
Government’s bailout of condos is beneficial not only for developers, but for realtors, too. It diminishes existing stock, removes toxic assests, and increases competition. Who would be losing in it? Probably, only a proverbial, abstract “taxpayer”. It is a win-win.