
Are you a fan of the Dave Matthews Band?
I had to mention it, right?
After all, just look at the title of today’s blog post!
For those of you who didn’t get the reference, The Space Between is the name of one of Dave Matthews’ biggest hits. You might prefer Crash Into Me, or maybe you prefer Ants Marching because of the epic violin.
To be honest, I used to get Dave Matthews Band confused regularly with Matthew Good Band. Can you blame me?
The song “The Space Between” is about the middle ground in a difficult relationship, the distance, the isolation, and what comes next.
When I look at the months of July and August in our real estate calendar, I always consider this time to be “the space between” two very busy and very distinct real estate markets.
Yes, I just compared the Toronto real estate market to a love ballad by one of the biggest musical acts of the 2000’s.
I did that.
The spring real estate market is fast-paced, frenetic, and incredibly complex.
The fall real estate market is just like the spring, except shorter, and thus often resembles the spring market but with elements of panic.
The space between these two markets is something completely different.
While I would hesitate to say that the summer is “slow” across the board, I believe that’s a common perception.
There are, of course, exceptions to the rule.
In mid-July, clients of mine found their dream home in Riverdale, on a prime street, steps from Withrow Public School.
They were all-in.
The property was listed for $1,349,000, and I told them, “If this were listed in March, I think they’d get $1,650,000 to $1,700,000 for it.”
We figured that the timing was perfect for us.
The freehold real estate market is often shaped by the school calendar, especially in family-oriented areas like Riverdale. Now that summer was upon us, we figured that there would be a lack of demand in the market because of three things:
- Thousands of buyers had already bought from January through June.
- Buyers who didn’t buy were exhausted and immersed in summer.
- New buyers rarely materialize in summer, as most wait until fall.
We figured that this house was going see fewer offers and a lower price than it would have, could have, should have in the spring.
On the scheduled “offer night,” we were the first to register.
I sent in our offer registration form at 9:30am. Offers were due to be presented at 5:00pm.
By 3:30pm, we still had the only registered offer.
But by 5:15pm that evening, there were twelve.
Our bid of $1,650,000, which was $300,000 over the list price, unfortunately did not prevail.
Do you remember No Fear Gear from the 1990’s? What was that saying they used to have?
“Second place is just the first loser.”
The property sold for $1,680,000, and while we were essentially tied for second place with another bidder, it didn’t matter. We didn’t buy a house that night, and even though I would like to think I know everything there is to know about Toronto real estate, I was very caught off guard by the response to this home.
12 offers.
In July.
So much for my theory about “the space between,” right?
Well, that one sale is the outlier, and the rest of the market has been quite sleepy. I’ve seen very poor results on “offer nights” with freehold homes, even those that check all the boxes.
It’s just the nature of where we are in the real estate calendar.
So why did I tell a story about a house that received twelve offers, rather than telling stories about properties that aren’t selling?
Because the summer can often be a predictor of what comes next.
That Riverdale home that received twelve offers in July might have received fifteen in September, or twenty in August.
If we’re seeing that kind of response during the space between the spring and summer markets, I believe that the response will be even greater once we pass Labour Day.
Not for the market as a whole.
Not for the 905.
Not for condos.
But for quality listings that are in-demand, and trust me when I say that there is pent-up demand out there.
And now, a cornucopia of market statistics!
The average home price in July declined 5.2% month-over-month, from June to July:
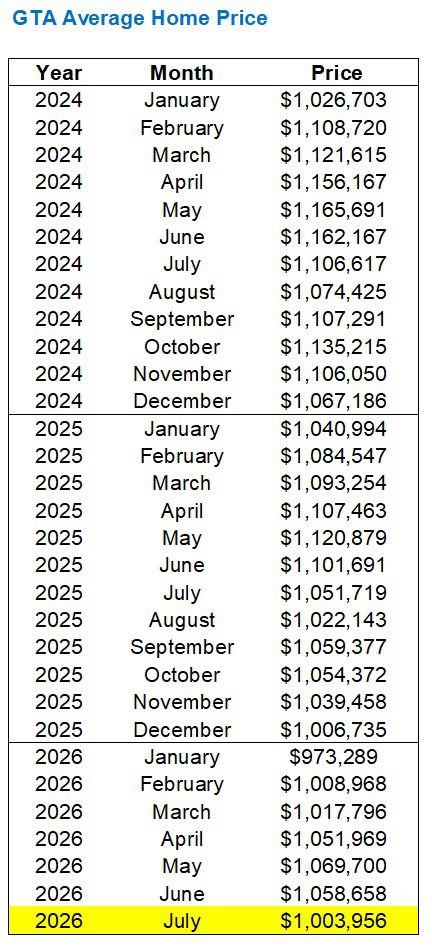
That seems like a lot for one month!
Sure, we know that summer will be slower, fewer properties will sell, and the average home price will be depressed as a result.
But how depressed?
The average movement from June to July from 2002 – 2024 is only 3.8%, so last month’s decline was greater than expected:
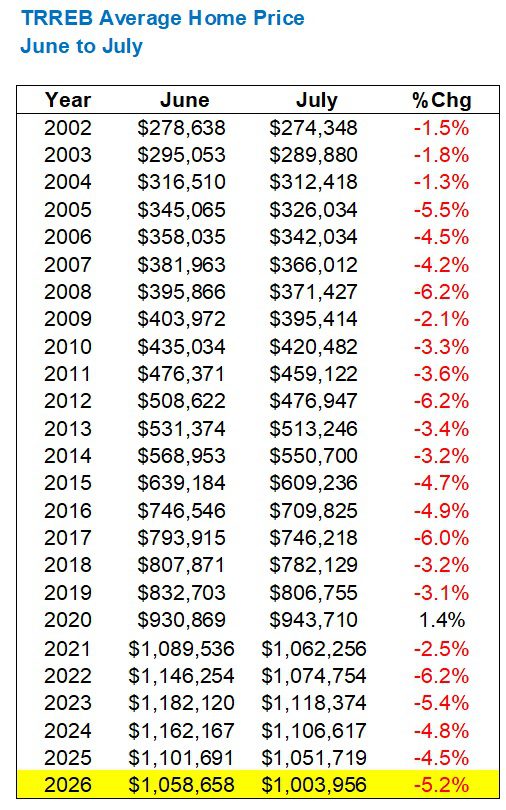
Ah, 2020!
The outlier that will be etched in my brain forever!
But save for that unusual, pandemic-affected year, we’ve seen the average home price decline from June to July every single year, and that will likely never change.
Now, on a year-over-year basis, the average home price is down 4.5%.
Keep in mind, this metric was upwards of 7.0% back in the winter, and has since come back down.
But the following chart tells us that July is either an outlier, or it’s the start of a trend reversal:
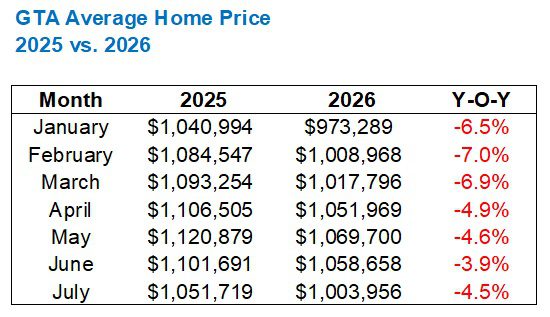
The fall market will tell us what’s really happening, but for now, the gap between 2025 and 2026 seems to be widening again.
When we look at the last three years graphically, we can see that the market is trending the way it usually does at this time
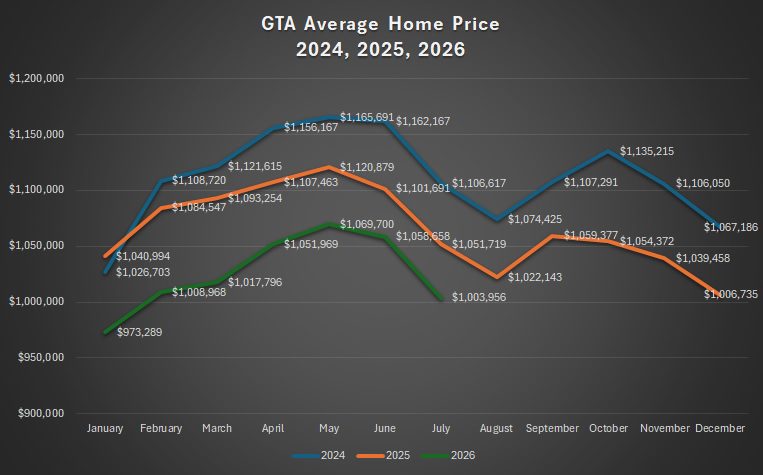
Maybe it’s just my freakish eyes, but I do see a sharper decline from June to July on the graph.
Not only that, we’re just over the $1,000,000 threshold.
Now, an important question:
Will we see the average home price dip below $1 Million in August?
I will predict…………yes.
As for sales, we saw a rather warm July in 2025, so I figured that might be tough to repeat.
When all was said and done, there were only 5,995 sales last month, which is lower than July of 2025:
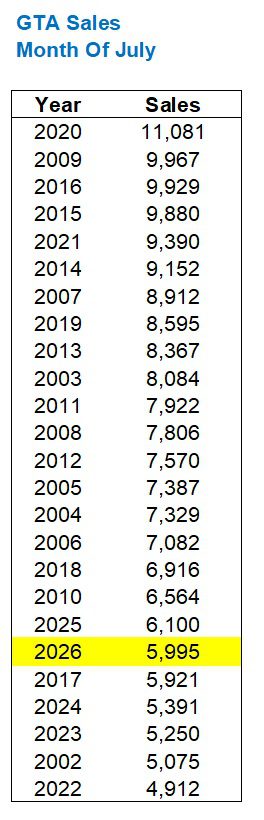
Below July of 2025, but ahead of July of 2022, 2023, and 2024.
As for how July compared to June, we’ve seen, on average, a decline of 13.9% over the last twenty-four years, so last month’s 11.4% decline was right in line:
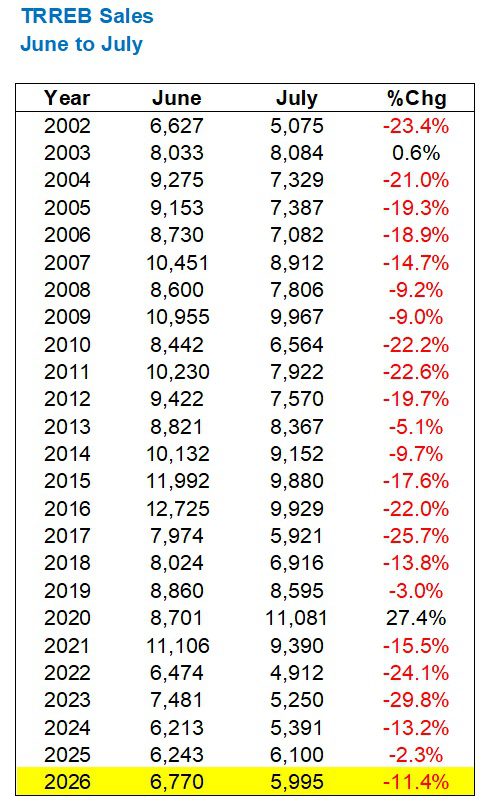
Again, 2020 sticks out like a sore thumb!
I suppose we could say the same about 2003, but that increase was marginal, and I was just getting into the business at the time so I can’t speak to what that market was like, if not unspectacular…
With last month’s sales coming in lower than July of 2025, we’re now pretty much on pace to match total sales from last year:
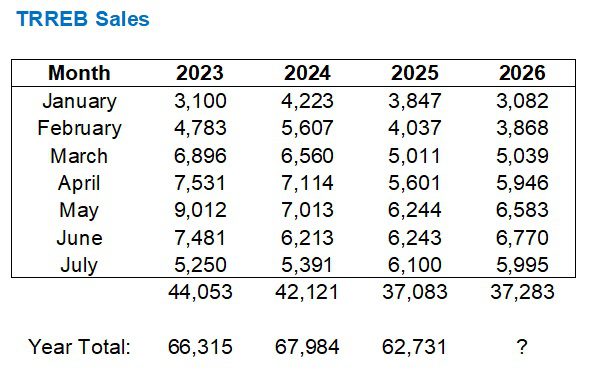
Why is this important?
Well, because sales in 2025 were the lowest this millennium!
And considering the population change over the last quarter-century, I would have no problem calling 2025’s sales data “the lowest all-time” if adjusted for population.
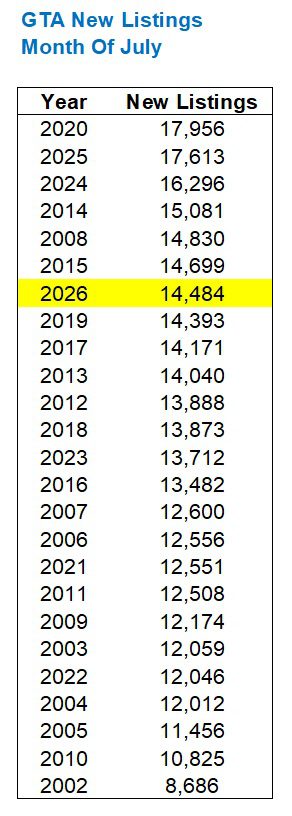
Now, what about inventory in this space between the spring and summer markets? Well, it’s not like the market was barren out there! While new listings were down 16.2% from June, there were still almost 15,000 properties listed last month.
That’s down 17.8% from July of 2025, but it’s worth noting that July of 2025 represented the second-highest figure of all time:
As for the relationship between sales and new listings, those 5,995 sales and 14,484 new listings gave us an absorption rate of 41.4%.
Anything below 50%, at least in theory, signals a buyer’s market.
As you’ll see below, the lowest absorption rates in July are ALL represented by the last five years!
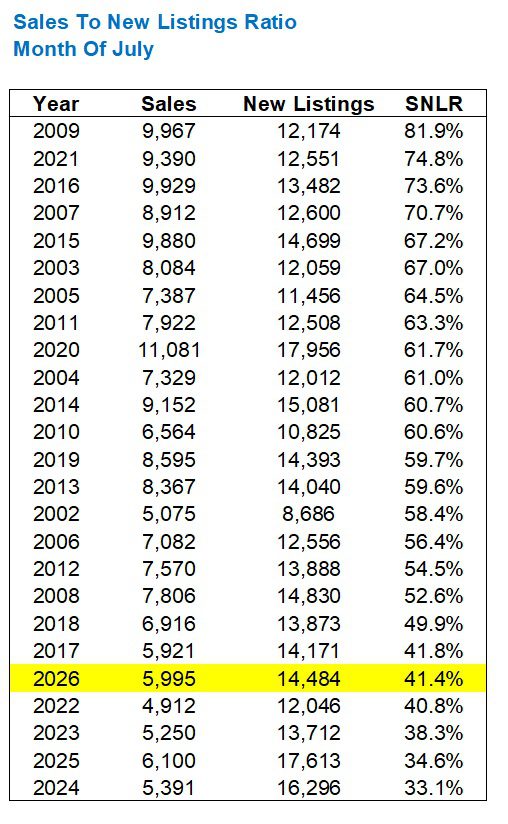
That’s incredible.
And sure, the absorption rate of 41.4% last month is higher than the 34.6% that we saw in July of 2025, but speaking of “seeing things,” I simply can’t unsee the fact that the last five years are all at the bottom of this chart.
Slow summer, indeed.
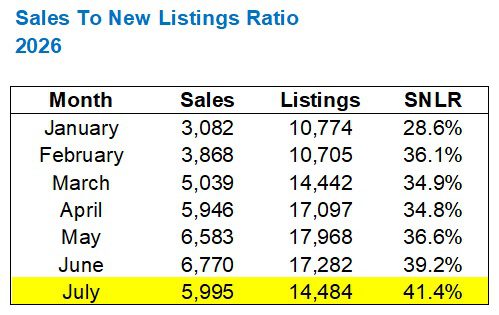
Now, as for the absorption rate in 2026, last month’s rate of 41.4% shows us that the rate is climbing as we head through summer:
Last, but not least, I want to return to prices again before we part ways.
We noted that the average home price in the GTA is down 4.5%, year-over-year, in the month of July.
But what happens when we look more at the major TRREB districts on their own?
How have those areas moved year-over-year?
Like this:
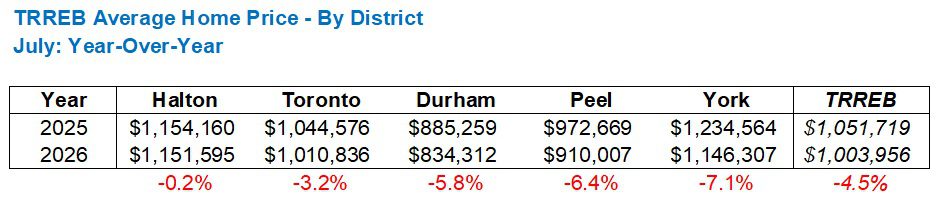
Again, this is only one month, but it gives us an idea of how that 4.5% average for the GTA is made up of smaller averages.
I would have guessed that Toronto is trailing the 4.5% decline and that York is ahead.
Frankly, I’m surprised Durham is only down 5.8%, but the area was hit so hard in 2025, that perhaps there’s only so much lower it can go.
So can we make any projections for the fall market based on the July stats?
As I said at the onset, I think it’ll be a seller’s market for prime, single-family homes in the central core this fall, but I also think we’re going to see a massive spike in inventory come September.
Labour Day comes late this year; September 7th! This means the September stats will be skewed, as the final week of summer actually takes place in September.
Now, let’s keep an eye on that August average sale price, shall we?