

I’m going to start today with a story.
A long, long story…
I’ve told this story in bits and pieces here on TRB over the years, but I’ve never told it in full. So here goes…
I went to McMaster University in the fall of 1998 to study business, and by the year 2000, I was obsessed with the financial markets.
There was a “trading centre” in the Michael DeGroote School of Business, and they had this awesome ticker that scrolled stock prices twenty-four hours per day, with green for stocks that went up, and red for stocks that went down.
I decided that I wanted to invest in the stock market, so I did what any 20-year-old would have done at that time: I called my dad’s stockbroker.
“Cap” was a man in his late 60s who had been through multiple market cycles, recessions, booms, and busts. He told me to come to downtown Toronto and visit him, in person, at his office.
So I did.
I journeyed down to First Canadian Place, found his office on the 50-somethingth floor of one of the big towers, and told him that I wanted to invest.
I was 20-years-old. I had accumulated a massive net worth, in my opinion, of $20,000. That represented the scrimping and saving of every dollar I ever made, making kebabs at Bruno’s Fine Foods, slinging fish at Metro, pumping gas at Sunoco, waiting tables at East Side Mario’s, and bartending at Shark City.
I gave Cap $17,500 of my net worth and waited for him to call me with investment opportunities.
But he never did.
I watched, every day, as stocks would shoot up by 5%, 15%, or 25%, and I thought I was missing out!
I had no idea what Research In Motion actually did, or what kind of company Fairfax was, but I saw the bright GREEN on the stock ticker and knew I had to get a piece.
I spent hours, every day, watching stock prices online. This was in the year 2000, so suffice it to say, all the tools available to you today were not available back then.
Then one week, I noticed that Nortel Networks had gone from $50, up to $55, down to $49, up to $56, and then down to $50 again.
It didn’t take much more than an episode of Sesame Street at an early age to teach me, “There’s a pattern here!”
I called Cap, and he answered.
I asked him what was happening, what the good word was, and what he was doing, and amazingly, he said, “I’m buying Nortel Networks.”
Holy crap.
That was exactly what I was looking at!
He said, “I think you could make a quick ten percent on the stock…”
And with that, Cap broke the very first rule in investing:
Successful long-term investors do not day-trade.
Cap looked at my portfolio of $17,500 in cash and said, “If I were you……I would…….I’d………I would buy 300 shares.”
I was “in.”
I loved it!
I told Cap, “Let’s do it. I’m in for 300 shares.”
And with that, Cap broke the second rule in investing:
Don’t put all of your f****** money into one stock.
Cap took a 20-year-old kid and had him day trading $15,000 of his $17,500 portfolio. But hindsight is 20/20, right?
The next day, the stock went up to $51, and I couldn’t believe I had just made $300.
The stock went up to $52, and I was on cloud nine. To me, $600 was an absurd amount of money.
Over the next week, the stock went up and down, and my emotions went with it.
The stock went as high as $53.50, and I couldn’t believe that I’d just made over $1,000. That was what I had made during an entire summer in 1996, working at Bruno’s Fine Foods!
Eventually, the stock dipped below $50, and I felt quite uneasy.
The stock hit $48, and I began to panic. Now I had lost $600. That was a lot of money!
But when the stock hit $45, and I had essentially lost everything I had made during the summer of 1998, pumping gas at Sunoco, I called Cap.
“I want to cut my losses,” I told Cap.
“This makes me really nervous, and I’m losing sleep,” I said. “Let’s sell at $45, and I’ll just work my ass off to make that back.”
Cap said, “Kid, this is just a paper loss.” It was the first time I had ever heard that term.
“The loss isn’t real until you exercise it,” he told me. “Just hang in there. This is the market we’re in, stocks go up, stocks go down, this is the game.”
Who was I to argue with this?
I was 20-years-old. On the other hand, Cap had been working in the stock market for over four decades! He knew what he was doing!
But Cap had just broken the third rule of investing:
Don’t believe that hope is a strategy.
I’ll never forget the day that Nortel Networks dropped from $45.00 to $30.00, exactly. It was quite the experience! That was the day that I broke every single weightlifting personal best at the gym at McMaster University, as I attempted to take out my rage, anxiety, and fear after losing another $4,500.
I called Cap and said, “What is your plan? This stock is heading to zero!”
Cap said, “Stocks don’t go to zero. You have to ride this out. If you sold now, you’d lose $6,000 of your $15,000. Do you really want to lose that much money?”
He told me, “You must stay in this fight!”
So I did.
And with that, Cap broke another rule of investing:
Don’t believe that time heals all wounds, and that every stock will eventually come back to where it was.
I watched the stock drop to $25, then to $20. Then to $15, then to $10.
When the stock hit $5, I transferred my portfolio away from Cap and his firm (which was one of the Big-5 banks) to a new online venture called E-Trade, and I sold the stock for $4 some time around 2002.
I lost my life savings on Nortel Networks at the age of twenty-two.
But the good news is: this taught me more life lessons than I could ever buy for $15,000, and I’m convinced that if I didn’t lose $13,800 at age twenty-two, I would have lost $1,380,000 at age thirty-two.
Those “life lessons” are a topic for another day, and I’m sure we all have those saved up, ready to tell our kids when the time is right.
The reason that I wanted to lead with this not-so-brief story today is because of an article that was making the rounds in the media last week:
“This Brampton House Just Sold At A $950,000 Loss. Inside The Unfortunate Events That Led To The Markdown.”
The Toronto Star
June 14, 2026
Now, the first thing I’ll say about this article is that people in the GTA are loving it!
Loving it? Really? Taking pride in the misery of others?
Yes! That is, and always will be, a hallmark of mankind, especially when it pertains to the Toronto real estate market.
For as long as I’ve been in this business, there have always been people calling for the market “collapse,” so those folks are oh-so-happy when they see a story like this one.
Not only that, the folks who will never own real estate, or will never own what they want, also love to cheer the market down.
But the problem with this article, and how it’s being portrayed and absorbed, is quite simple:
This does not represent the overall market.
A large segment of society would love to believe that the “real estate market” is down by 50% across the board.
But it’s not.
Cases like this one are extremely isolated, and unfortunately, when these situations arise, the media is going to slather the front pages with it.
From the article:
A four-bedroom home in Brampton appears to be the latest sign of a GTA suburban housing crash.
The detached house — with opulent kitchen upgrades, a two-car garage, and a basement apartment — sold last week for $1.25 million, $950,000 less than it last sold for in February 2022, according to real estate data platform HouseSigma.
It’s, perhaps, an extreme example of a trend that’s been playing out across the GTA in recent months. Homes with property values that skyrocketed at the height of the housing market in 2022 are now experiencing a deep price correction.
For those who don’t love math, let me spell it out for you: this house was bought for $2,200,000, and sold for $1,250,000.
The media are going to use the figure that’s the most eye-catching.
The headline could have read: “Brampton Home Sells For 43% Loss!”
But that’s not as sexy.
Losing just shy of a million dollars is sexy as hell.
The article, which is written with the benefit of hindsight, has a recurring theme throughout: “Why didn’t they sell sooner?”
But those who have never actually exercised a large financial loss in their lives can’t possibly understand what actually has to transpire, both mentally and functionally, for a person to finally pull the trigger.
So, as an exercise, let’s look at this house, the market in which it’s located, and the timeline over the last several years, just to show how difficult a process this actually was.
This house is in Brampton, which is within the Peel Region MLS district.
Most notably, and rather sadly, the house was bought on February 25th, 2022, which is literally the peak of the market.
Let’s get a baseline for price activity, shall we?
How about we use the start of 2020? Right before the pandemic made the market go bust, then boom?
If we were to plot the appreciation in Peel Region versus that of Toronto, from the start of 2020 through when this house was purchased, it would look like this:
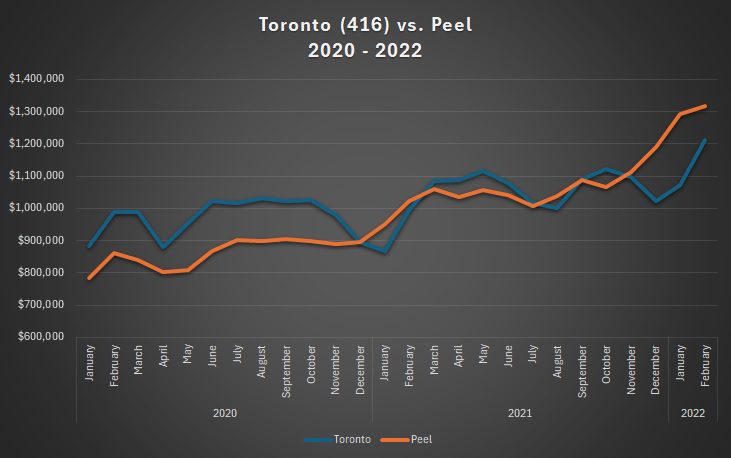
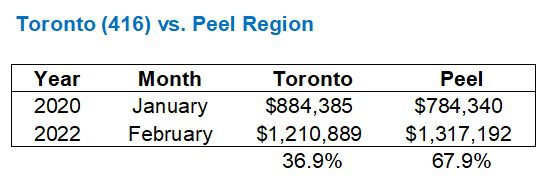
If you’re not seeing what I’m seeing, let me spell it out for you:
A home in Peel Region went from being worth less than a home in Toronto, in January of 2020, to being worth more in February of 2022.
Listen, Peel Region is great and all, but the rate of appreciation didn’t make a lot of sense here, comparatively speaking:
Having said that, I’m going to show you a statistic that makes even less sense.
Pay close attention, because this one is really, really important!
The folks who sold the house for $2,200,000 on February 25th, 2022 had only owned it for two years!
In fact, they bought it almost around the time that our price analysis begins in the above chart and graph.
They bought the house on February 19th, 2020.
And for how much?
Here’s where it gets really crazy, folks…
Let’s revise the above chart only to look at Peel, and let’s include Brampton as well. We’ll run the chart from February of 2020, when the house was bought, to February of 2022, when the house was sold:
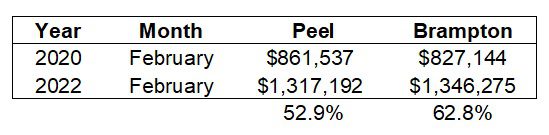
Alright, so the appreciation in Peel isn’t quite as high as in the previous chart, as it comes in at “only” 52.9%. But we see that Brampton is on fire! It’s up 62.8% in two years!
So here’s where the stats “make even less sense,” as I teased above.
Because the folks who sold the house on February 25th, 2022, for $2,200,000 “only” paid $1,056,000 for it on February 19th, 2020!
Statistically speaking, this was a massive overpay.
How much?
Check this out:
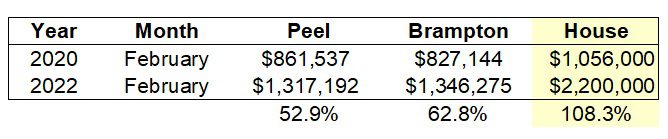
With the benefit of hindsight, we can all safely conclude, “A house shouldn’t double in value in two years.”
Blame me if you want to, for “being a part of this mess,” but I wasn’t selling houses in Brampton in 2022. I was here in the 416, where houses “only” went up by 30% in two years! 🙂
So while the folks who purchased this house might have overpaid, the headline in the Toronto Star article makes it seem like a $950,000 loss is representative of how the market has moved.
Now, why didn’t the owners sell sooner?
From the article:
Singh said the couple that bought it in 2022 only lived in the home for a year before separating and renting it out. But the rental income wasn’t enough to cover the mortgage, property taxes and home insurance.
Here’s where we start to see the difference between a stock and a house.
This couple separated. That’s very important.
Because anybody who has been through this before will know that the disposition of the matrimonial home is far from easy.
There’s a difference between a separation and a divorce, and both are complicated. Both, rather unfortunately for the folks in this story, will take a lot of time and kick multiple cans down the road, so to speak.
Whether this couple deliberately kept the house as an investment, or did so because they needed to finalize a separation agreement or a divorce, remains to be seen.
But here’s one very, very important difference between a stock and a house:
A stock can go to zero. A house can’t.
Think back to my experience with Nortel Networks. I bought the stock at $50 and rode it down to $4 before I finally sold it, and eventually, it went to zero.
My stockbroker, “Cap,” made it sound like all stocks come back.
But they don’t.
Companies can go bankrupt. Stocks can go to zero, and even if they don’t, they can drop in value by 95%, or 80%, and so on.
The value of a home can plummet as well, but on a long enough time horizon, hypothetically speaking, a home’s value will come back.
It might take until the year 2050 for this house in Brampton to be “worth” around $2,200,000 again, but it will happen.
This is an important distinction because it offers an answer to the question of “why” the owners of this house, at least initially, decided to keep it and rent it out.
Maybe it was due to the separation, or maybe it was because they figured the value would come back.
Either way, they elected not to exercise the loss when they separated in early 2023.
As the story goes, however, they finally put the house on the market for $1,599,000 on August 9th, 2024.
August is an extremely slow month. In fact, outside of December 15th through January 1st, I can’t think of a slower two-week period than the last two weeks of August.
Now, here’s how the market moved, at least statistically, from when they bought in February of 2022 to when they listed in August of 2024:
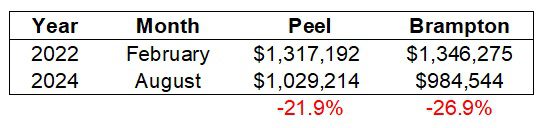
That’s not bad!
In fact, if we took the higher of the two figures and subtracted 26.9% from the $2,200,000 that was paid for the house, then it would be worth $1,608,881.
Perhaps that’s why they listed for $1,599,000?
Ah, but wait!
We know they overpaid, right?
Let’s go back to this chart for a moment:
Right. They paid way more than the market had moved.
Now, let’s pretend, for a moment, that the folks who paid $1,056,000 for the house in February of 2020 sold it for 62.8% more in February of 2022.
That figure would be $1,719,168.
Who knows whether the $2,200,000 purchase price was exactly $480,832 over what it was worth, but this gives us a baseline!
Now, if we subtract the 26.9% decine in the Brampton average home price from the $1,719,168 “value” of the home when it was bought, then it would be worth:
$1,256,712
And yet, they listed for $1,599,000.
This doesn’t happen in the stock market, of course. A stock could be trading for more than it “should” be, based on a Price/Earnings ratio or some sort of analysis of the underlying fundamentals, but with millions of shares of a stock trading every single day, you don’t really see somebody paying $2,200,000 for a house that’s worth $1,719,168.
Suffice it to say, the house didn’t sell in August of 2024 when it was listed for $1,599,000.
In fact, it remained on the market at $1,599,000 until June of 2025. It was listed four times at $1,599,000.
In June of 2025, the property was re-listed for $1,499,900.
It wasn’t until March of 2025 that the price was adjusted, yet again, to $1,399,900.
In April, the price was changed to $1,359,900.
In June, the house sold for $1,250,000.
Here’s how the market moved from the day they listed to the day they sold:
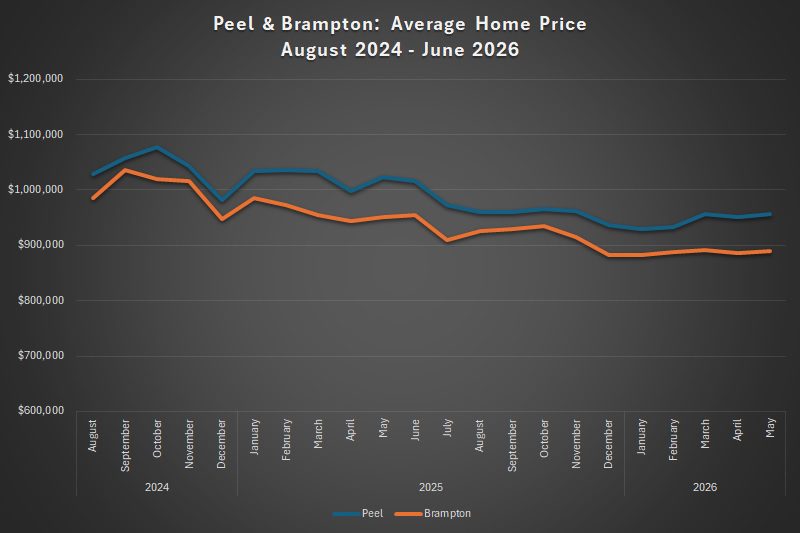
To be fair to the sellers, they lowered their asking price more than the market declined!
The property was first listed in August of 2024 for $1,599,000 and was last listed for $1,359,000 in June of 2026 (using the statistics from May).
Thus, they reduced by 15.0%.
At the same time, the average home price in Peel declined by 7.1% and in Brampton by 9.7%.
But the sellers had already erred in a way that’s impossible to come back from:
They never got ahead of the market.
To use a football analogy: you don’t throw to where the player is, but rather you throw to where he’s going. If you throw to where the player is, then by the time the ball arrives, he’s already run 8-10 yards further, and the ball is behind him.
The sellers paid too much when they bought, they waited too long to list, and they listed too high once they did.
Unfortunately for our purposes, there’s no analogy to the stock market here.
But there is a comparison to the stock market and other types of investing:
It’s really hard to exercise a loss.
No matter the market, the investment, the amount, the timeline, or the individual, it’s always hard to turn that paper loss into a real one.
In an unrelated story, how are all y’alls shares of Space X doing?


Serge
at 12:18 pm
20K at 20 yo?! Kudos!
And that 60+ schlimazl?! What Dad thought about?!
It calls for a family movie…
Peter
at 5:19 pm
Great story, David! A sad tale though. It’s too bad you couldn’t sue your stock broker for gross negligence and incompetence, but they probably had you sign a contract that indemnified them.
Could you draw a parallel between that stock broker and all of those irresponsible agents selling preconstruction condos after the pandemic?
Derek
at 9:27 am
I think most if not all of us predicted the GTA market price would have peaked again by the time they put it on the market. If the collective “we” were right about that, they would have been just fine!
JL
at 11:49 am
“With the benefit of hindsight, we can all safely conclude, “A house shouldn’t double in value in two years.” ”
To be honest, I’m not sure we ‘really’ need hindsight to figure that out🙂
Having heard bits and pieces of your early investing stories, I’m surprised to learn your main mistake was actually trusting an institution guy. All along I was assuming it was because you signed up for an early self directed online investment platform from one of the banks and just got caught up in the dot com and/or resource run ups of that era.
David Fleming
at 12:15 pm
@ JL
To be fair, this was a little bit of both.
I was young, stupid, and did get caught up in the dot-com bubble. I wanted to take part.
Having said that, I trusted a life-long “expert” of the financial markets and put my faith in him. He was 60-something years old, had been trading through the 1970’s, 80’s, 90’s, and 2000’s. He had worked though mulitple recessions. He should have known better than to take a kid and have him put his life savings into ONE stock, then tell him not to sell it, at any point, then have him ride it down to zero.
In hindsight, it sounds crazy. Like there must have been more to it, or I’m leaving something out.
But it’s that simple.
Now, I also don’t think that “kids today” should be day-trading on self-directed platforms. It’s no different than gambling. They have no actual knowledge of what’s going to happen in the market, but they all think they do. They all think they can beat the market. But the house always wins…
Different David
at 11:55 am
I think it’s strange why people are terrified that their house could go down in value, but have no qualms about a $70,000 car or $150,000 boat depreciating to a tenth of what it costs in a matter of years.
Serge
at 2:41 pm
may be because car dealers, unlike realtors, never ever told customers: “your car value only goes up, up, up! you better buy now.” Naturally, on rare occasions when it happens for houses, people are terrified. But for cars, people simply do not expect appreciations.
Ace Goodheart
at 1:29 pm
You can find pics of that house on the various house listing sites.
One item stands out – the lot. It’s awful. If you stuck a broom handle out the back door you could touch the fence. If you taped two broom handles together you could touch the back of the neighbouring house
No back yard at all. Just a paving stone covered walkway type space.
Why do they build new houses without back yards?
Are the same people who built the dog crate condos also designing out door space in new build homes?
The lot sucked. And you can’t fix the lot.