

Last week, one of the members of my team, who wants to keep his anonymity, made an interesting suggestion.
“Matthew M.,” as we’ll call him, pulled no punches.
Wait, that’s too obvious. Let’s just call him, “M. Morrison” instead.
The suggestion was, and I know this is going to sound crazy, that I might not always be right…..about everything.
I think it went something like, “You know……..you’re not always right, as crazy as that might sound to your delicate ears.”
It’s not the ears that are delicate, it’s the lobes. And yet I don’t regret those two huge silver hoop earrings that I wore from 1999 through 2002, but that’s a topic for another day…
I was reminded of this old adage about being right:
“Our addiction to always being right is a great block to the truth.”
Perhaps.
But if you’re always right, then I think this logic doesn’t apply…
Having been wrong about the average home price increasing substantially in March, I might not have been in a position to double-down in April, but I did.
The market subsequently responded with a 4.0%, month-over-month increase in the average home price.
Last Monday, we were sitting in our team meeting and one of the topics was “TRREB stats,” since I figured they would come out on Friday. I told the team, “I expect the TRREB average home price to come in just shy of $1,200,000.”
“If at first you don’t succeed, try, try again…”
While the figures for March didn’t really reflect the “feeling” out there in the Toronto real estate market, the figures for April and May sure did.
And as you’ll see in today’s look at May’s market statistics, we can safely (?) draw three conclusions:
1) The “market bottom” is in the rear view mirror.
2) The market has clawed almost all the way back from last year.
3) The market is just about at the spring peak.
We’ve talked a lot about “market bottom” in recent months, with some readers commenting that a new bottom, ie. one with an average TRREB sale price below $1,038,668, would be reached later in 2023, or in 2024 or even 2025.
With a 3.7% increase in the average home price from April to May, we’re now 15.2% ahead of the $1,038,668 price recorded in January, whether we agree that this is “market bottom,” or not.
Year-over-year, the May average home price is “only” down 1.2%. I say “only” because that figure was 17.9% in February.
As for the market “peaking” in May, more on that later.
Here’s a refresher for the average home price over the last twenty-four months:

As I said, we’re down 1.2% May-over-May, but that doesn’t mean we’ve “caught up” to the peak from February. The average TRREB home price is still down 10.4%, but there’s huge variation among the five major TRREB districts. More on that in a moment.
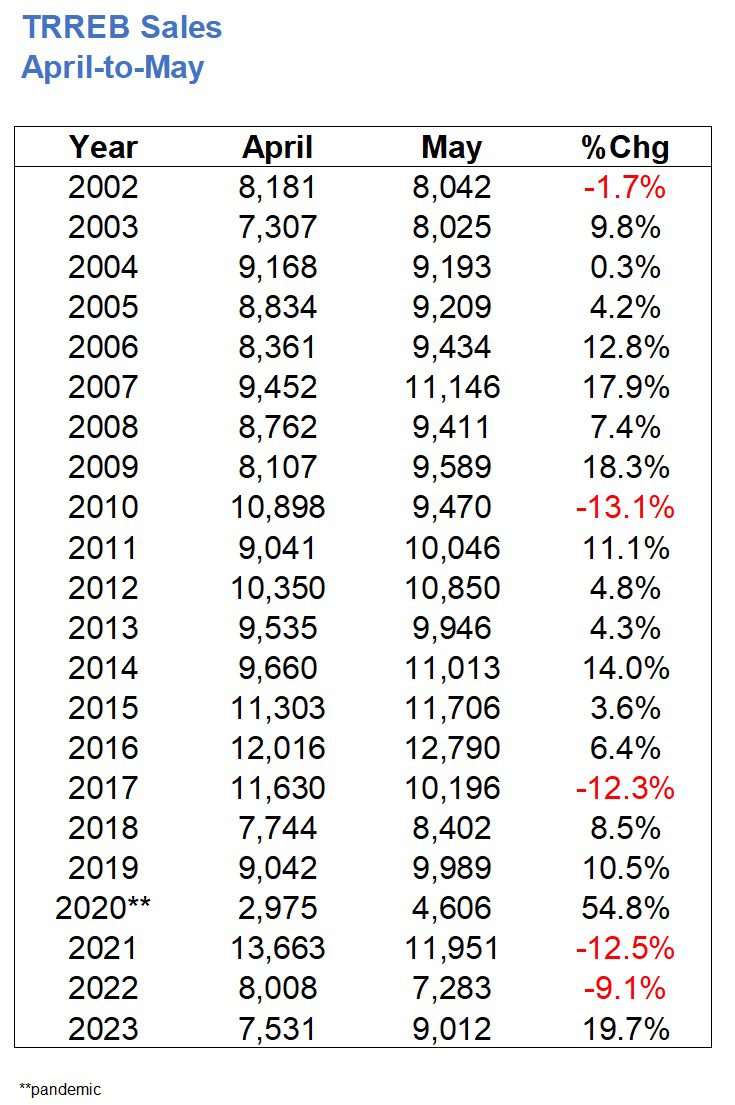
Sales were up 19.7% month-over-month, but that’s to be expected. Right?
In the previous twenty-two years, sales have increased from April to May seventeen times.
Moreover, if you look at the five times in which sales did not increase from April to May, you’ll note that 2017 and 2022 were included in those five years.
What happened in 2017 and 2022?
The government made sweeping changes (or attempted to, as was the case in 2017…) that had a severe effect on the real estate market.
Call this an “artificial drop” if you want, or a much-needed one. But any way you look at it, the slowdowns in May of 2017 and May of 2022 were a direct result of actions by the government:
Recall that in April of 2023, we experienced the third-lowest number of sales in any month of April since 2002.
In March of 2023, we also experienced the third-lowest number of sales in any month of March since 2002.
Did that trend continue in May?
Nope!
The 9,012 sales recorded in May were the sixth-lowest since 2002:
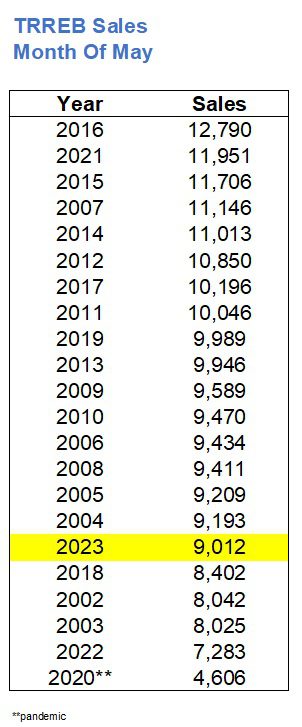
That’s not a terrible figure, however.
And as we know, the market has been severely impacted by lack of inventory.
Case in point: I have two active buyer clients that started their searches in January who have yet to even make an offer because they can’t find what they want. I also have two clients from last fall, and believe it or not, I have another set of clients who are two years into their search. And the problem isn’t them; it’s the market. Yes, they’re looking for something specific. Yes, they have made two offers in two years and lost, but for some buyers out there, the dearth of inventory has never been more pronounced.
As for new listings, we saw the fewest ever for the month of March two months ago, and April saw the second-fewest, but it was the true fewest, for all intents and purposes, since the record was April of 2020 and that was at the height of the pandemic.
So did May follow suit?
Nope!
We saw the sixth-fewest number of new listings since 2002 this past May:

Sixth-fewest, yes. But it’s not as dire as it felt in March and April.
15,000’ish new listings instead of 18,000’ish new listings isn’t going to have a dramatic effect on the market.
It truly felt, this past month, like we had more choice out there than in any month so far this year.
Now, let’s switch gears back to average sale price and look at how the 3.7% month-over-month increase from April to May played out across the GTA.
While there are seven TRREB districts, we leave Dufferin and Simcoe behind and focus on Toronto, Halton, York, Peel, and Durham as they make up about 95-96% of the market, and the sample size for Dufferin and Simcoe would be too small to compare month-to-month.
So here’s how the 3.7% increase breaks down by district:
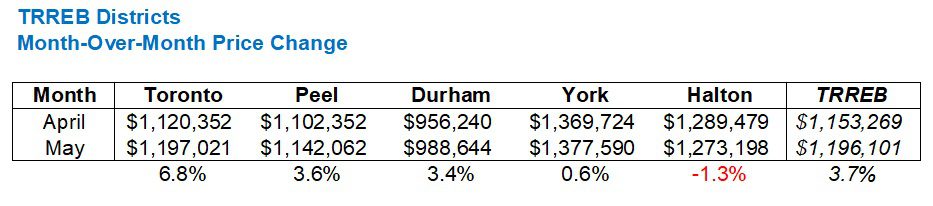
Some might be surprised by this, others certainly won’t be.
Toronto should lead the pack in a market that’s trying to regain lost ground, whereas in an unexpected boom period (like 2020-2021), you wouldn’t be surprised to see areas like Durham Region out-appreciating the 416, since it’s where the cheapest real estate is located.
But this isn’t a one-off month, however.
In fact, if you looked at the April-to-May gain in each district along side the March-to-April gain, you’ll essentially see a continuation of a trend that began two months ago.
You’ll also see, as you did above, that the 416 has been gaining serious momentum:
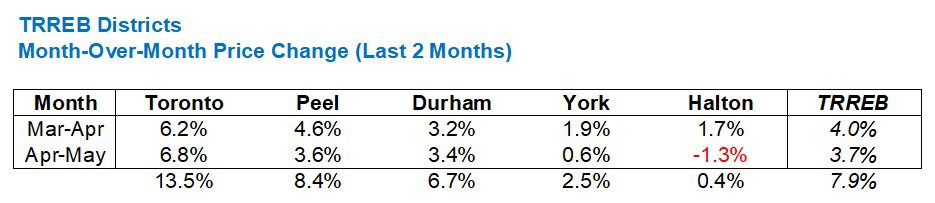
If you’re seeing that the math doesn’t align, remember that we’re comparing May to March, and not adding the two months together. They’re just shown one-atop the other for reference.
A 13.5% increase in the 416 in two months is massive. There’s no way to chalk this up to an outlier or seasonality, and while we are just about at the spring peak (more on that in a moment), this isn’t true seasonality. This is the market clawing back significant lost ground.
If you want to go all the way back to the start of the year and see how each district has compared, it’s more of the same, save for Halton:
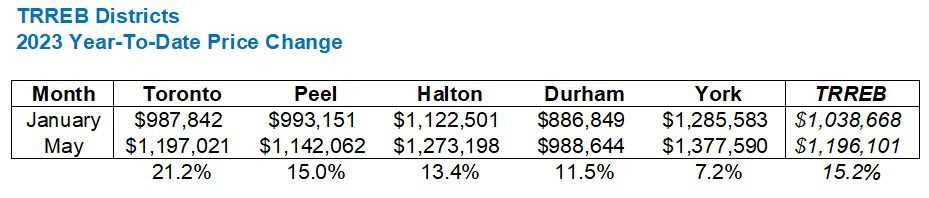
Interesting that the TRREB average home price has increased by 15.2%, but the 416 is the only one of the five districts that actually surpassed that number.
A 21.2% increase in the 416 is big, but again, I consider that simply gaining lost ground, not to mention, January is always an artificially-depressed month.
Also interesting that Halton, which saw only a 0.4% gain from March to May, is in the middle of the pack with a 13.4% gain from January to May. That goes to show you just how hot Halton was in the first three months of 2023.
Now, if you want to compare each district to that peak in February of 2022, here’s where things get the most interesting:
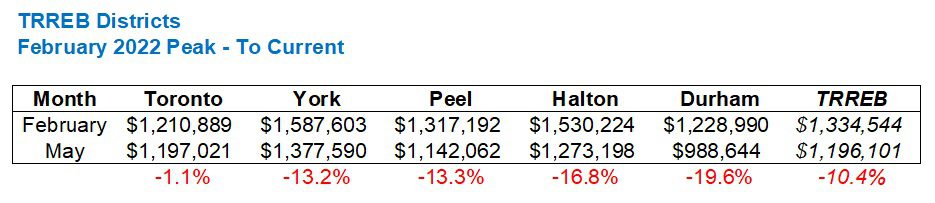
Toronto is in a league of its own here.
-13.2% through -19.6% looks like a normalized range.
But when we throw in the -1.1% at the onset, it truly feels like an outlier.
It reminds me of that Sports Illustrated issue from the 2000’s where the cover was a fold-out, and you saw a pack of six or seven female runners all in a tightly-grouped pack, but when you folded out the rest of the cover, you saw how far ahead Marion Jones was.
Okay after a lot of searching, here’s the best example I can find:

Now I find myself waiting for one of you to make a steroid reference and come up with an analogy to the 2023 real estate market that will make me regret my analogy in the first place… 🙂
So then, where does the market go from here?
I mentioned a couple of times now that we’d discuss this concept of the “spring peak.”
With the average home price in the GTA now up to $1,196,101, and on the heels of a 4.0% and 3.7% increase in each of April and May respectively, can we expect the market to continue to increase into June?
An argument in favour of that notion would be that the market started slow in 2023, unlike in 2022, and thus we should see a late peak in June.
An argument in opposition to that notion would be the chart below:

In twelve of the previous twenty-one years, we saw the spring peak come in May.
A June peak is equally as likely as an April peak.
And February of last year just looks awkward out there on its own…
Personally, I’m going to predict that June sees a modest decline; something like 1% – 1.5%.
I would be more surprised than not to see any sort of increase, but I think the market is strong enough to ensure the average sale price stays close.
A decline above 1.5% would, in my opinion, result from weakness in the 905.
Remember I said that, and let’s come back to this next month…


Appraiser
at 11:57 am
Evidently unstoppable.
P.S. Great data!
JF007
at 1:05 pm
Just wondering if a rate hike might throw a curveball though
Ace Goodheart
at 1:14 pm
I don’t think Tiff has the nuts to do it. He is not Paul Volcker.
We will see tomorrow, but I am betting that rates stay the same. Tiff is a bit too “woke” to raise them again.
Dale
at 10:05 am
Ouch!